Hi teowj,
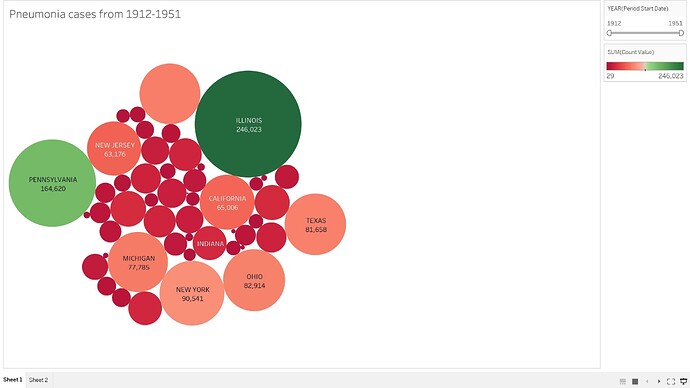
Nice chart! I can see three problems straight away:
- your color scale is very deceptive for two reasons. The first is that you’re using a red-green scale which, apart from not being color-blind save, is overloaded by some cultural conventions. For example, if I see a green state, I think that state is well of. While there is some truth in this case for your example, I wouldn’t say that that green states are well of and red ones are not.
- that leads me to the 2nd suggestion. You are using diverging scale (green on one side and red on the other). this somehow implies that there is a neutral center which is none of the two poles. I believe this is less of a cultural as a perceptual and cognitive problem. In other words, you’re splitting your states into those being to either the one side (green) or the other side (red) of this neutral point. However, looking at your scale, this goes from 29 to 246,023. This is a linear scale and you should use a linear scale to reflect those values. Check the sequential scales at Colorbrewer (http://colorbrewer2.org/#type=sequential&scheme=BuGn&n=9), for inspiration. Or, in the simplest case, just darkens does your job
- eventually, the third issue is that your color scale is not changing linearly with the values. Look at the white spot in the center. This is a lot of change in color and darkness, but only a very little on your scale. This is misleading.
Another remark I would have is that your observation is not visible from the graphic. I.e. you could calculate the trends and show them through color or alike.
In summary, I would avoid bubble charts entirely. Comparing sizes for quantitative data is less accurate than e.g., length. Check Mackinley’s seminal studies: http://courses.ischool.berkeley.edu/i247/f05/readings/Mackinlay_APT_TOG86.pdf.
Even it it hurts, I would use a simple bar chart here. You can then think about how to encode the trend. Either through colors, more bars or line charts. It’s often best to start with the simplest and most common design, then trying to extend where it falls short.
Hope this is helpful, and looking forward to iterations,
cheers,
ben

