DOI: 10.25337/T7/ptycho.v2.0/US.186499007
Name of Tool: Tableau
Country: USA
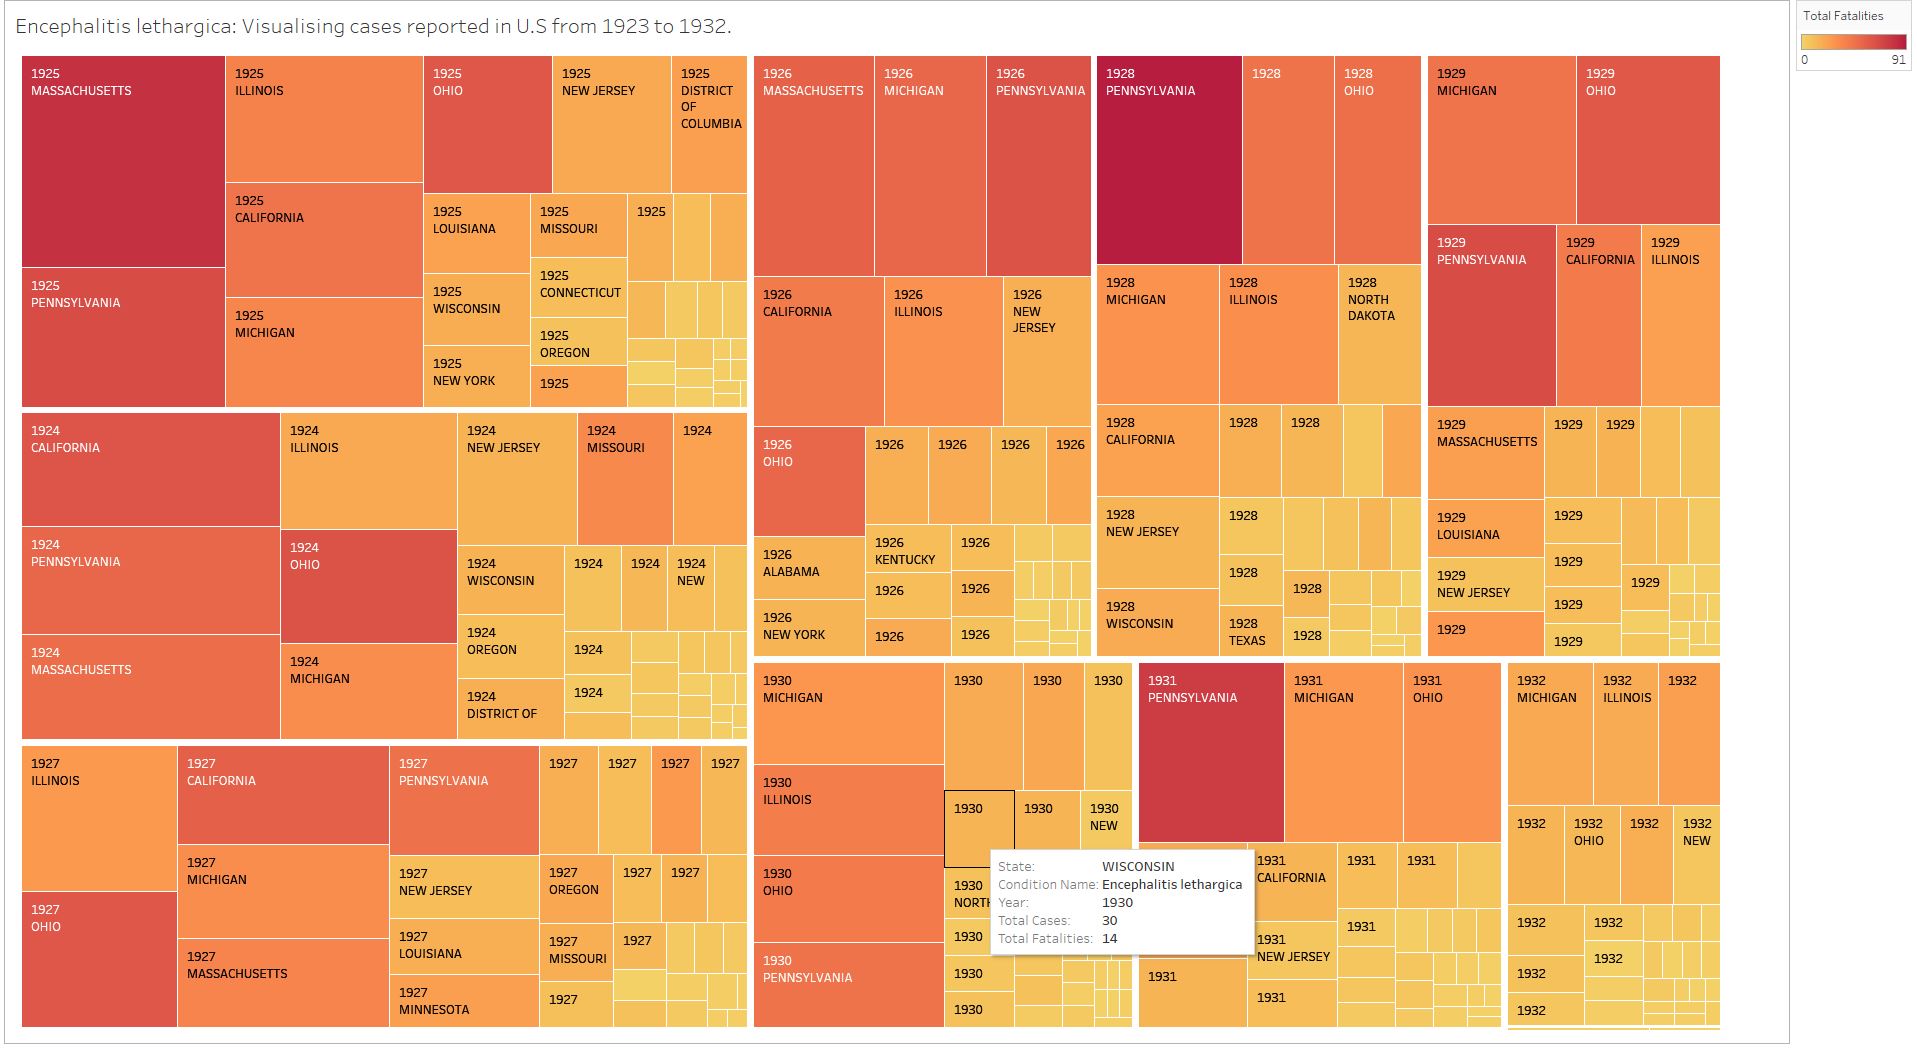
Disease: Encephalitis lethargica
Years: 1923 to 1932
Visual Mappings: Size is determined by the total number of cases, for each state, for each year.
Colour is determined by the total number of fatalities, for each state, for each year. (Low-Saturation, gold colours for low fatality rates, High-Saturation, red colours for high fatality rates).
Data Preparation: For this visualisation I calculated the year values by creating a pivot table using the Period Start Date and Period End Date. I then calculated the total cases by summing the Count values for each year (split by state). I also calculated the Total Fatalities by summing the count value for each year (split by state) if the conditional statement “Fatalities = 1”.
For this tree map I have chosen to make “Year” the parent of “State” in the hierarchy thus splitting the instances of a state into separate “Year” groups.
Is this the best format for Visualising this data, or should I rethink the hierarchy and make “State” the parent of “Year”?
The following blog provided some useful information about hierarchical data, and helped me make a decision on how structure my hierarchy:
https://www.microsoft.com/en-us/microsoft-365/blog/2015/08/11/breaking-down-hierarchical-data-with-treemap-and-sunburst-charts/
The following paper provided more in-depth look at Tree Maps and how I can utilize one for this task:
Turo, David & Johnson, B. (1992). Improving the Visualization of Hierarchies with Treemaps: Design Issues and Experimentation.. 124-131. 10.1109/VISUAL.1992.235217.
Thank you for any answers to my question,
Luke Hengstenberg,