
I am a university student at Swansea University doing a Data Visualisation coursework. I am trying to visualise health data, specifically from Project Tycho. I am trying to visualise the number of cases of Babesiosis in the USA for the years 2014-2017
Data from:
https://www.tycho.pitt.edu/dataset/US.21061004/
Van Panhuis W., Cross A., Burke D., Counts of Babesiosis reported in UNITED STATES OF AMERICA: 2013-2017 (version 2.0, April 1, 2018): Project Tycho data release
DOI: 10.25337/T7/ptycho.v2.0/US.21061004
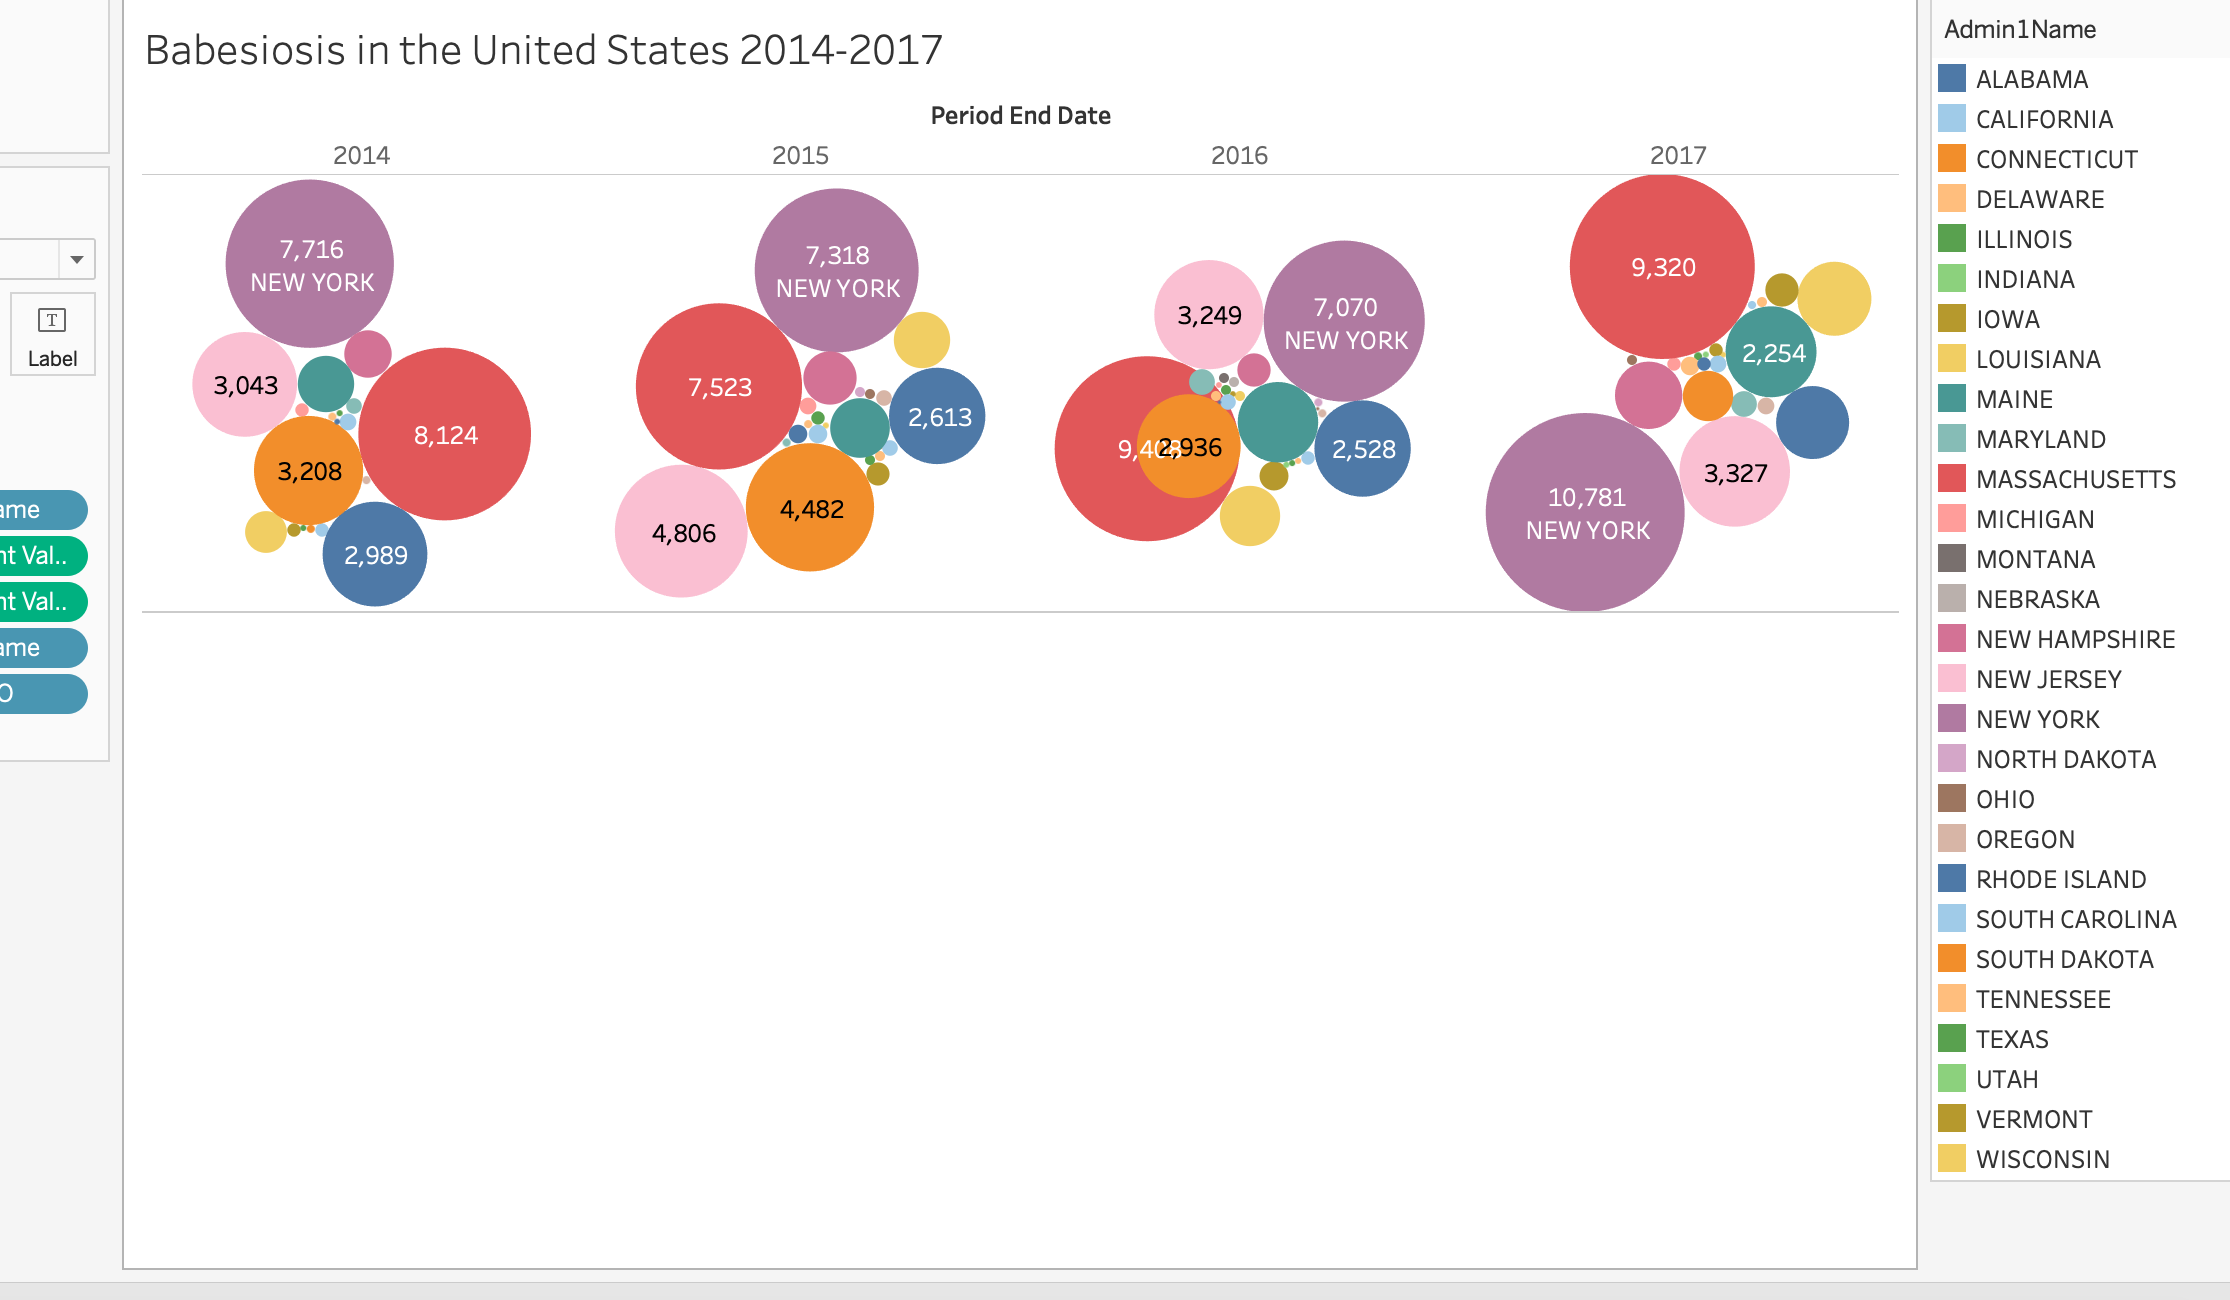
Description of Image:
Visual Design Type: Packed Bubbles
Name of Tool: Tableau
Country: United States
Disease: Babesiosis
Year: 2014-2017
Visual Mappings:
Admin1Name to colour, SUM(Count Value) to size, SUM(Count Value) to label, Admin1Name to label, Admin1ISO to label
Unique Observation:
Throughout the four year period 2014-2017, it is evident that New York and Massachusetts were the most affected places. It is also easy to see that the third most affected place for the years 2014,2015,2016 was Connecticut. However in 2017 the number of cases there decreased dramatically. This however was not the case for New York. The number of cases increased by approximately 50% since the previous year.
I am looking for some advice on my design. More specifically:
Does the type of visual design chosen make sense for this dataset?
Is my observation correct?
How could I improve my design to get more information from it, and, are there any other methods I could use to better visualise the data?