
Trends in Primary Energy Generation in Canada At a Glance
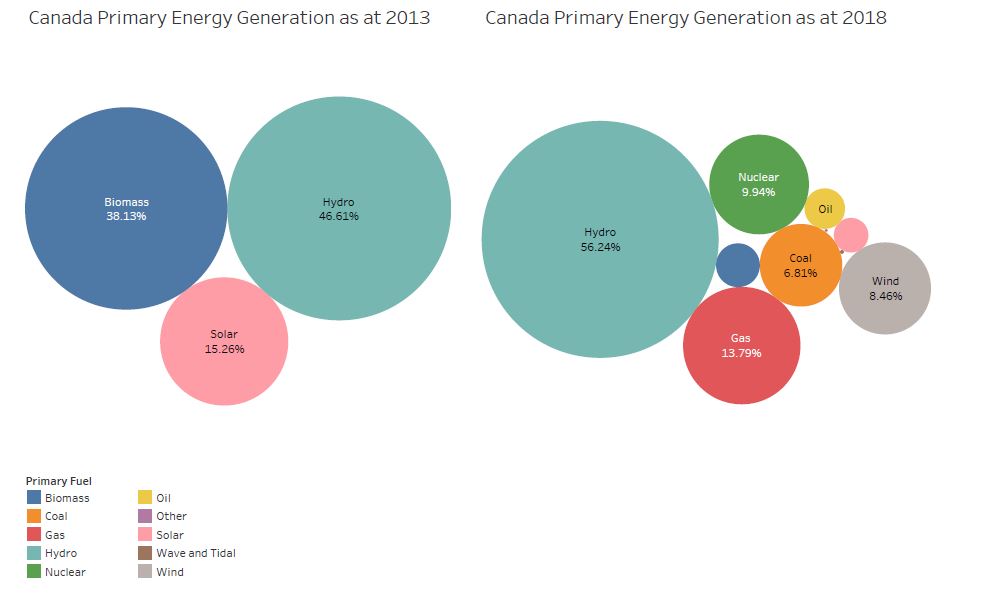
Image : Trends in Canada Primary Energy Distribution over selected periods
Visual Design Type : Packed Bubbles Visualization
Name of Tool : Tableau
Country: Canada
Year : 2013 vs 2018
Visual Mappings : Primary Fuel for Canada, Capacity MW, Year of Capacity at 2013 and 2018 respectively.
Size shows % Capacity up till 2013 and 2018 for various primary energy source
Data was filtered on Country and Year of Capacity
Percentages are fraction of energy source with respect to total.
Unique Observation
Overall, there is a significant increase observed in Hydro Power generation between 2013 and 2018 in Canada, whereas, energy sources such as Biomass and solar experienced a downward trend. However, over this same period, sources such as gas, nuclear and wind also experienced significant growth.
Dataset Source: Global Power Plant Database
Data Preparation:
Filter countries for Canada only
Filter of Generation of Capacity for years up till 2013 and 2018 respectively
Percentage conversion of Primary Energy source subset using Analysis in Tableau
Questions:
- Trends revealed only recent exploration of some energy sources based on dataset. Is this valid?
- Is there a better way to present data?
Other observations and comments are gladly welcomed!