
Visual Design Type: Map + Bar Chart
Name of tool: Tableau
Country: South America continent
Years: All the years in the data sets
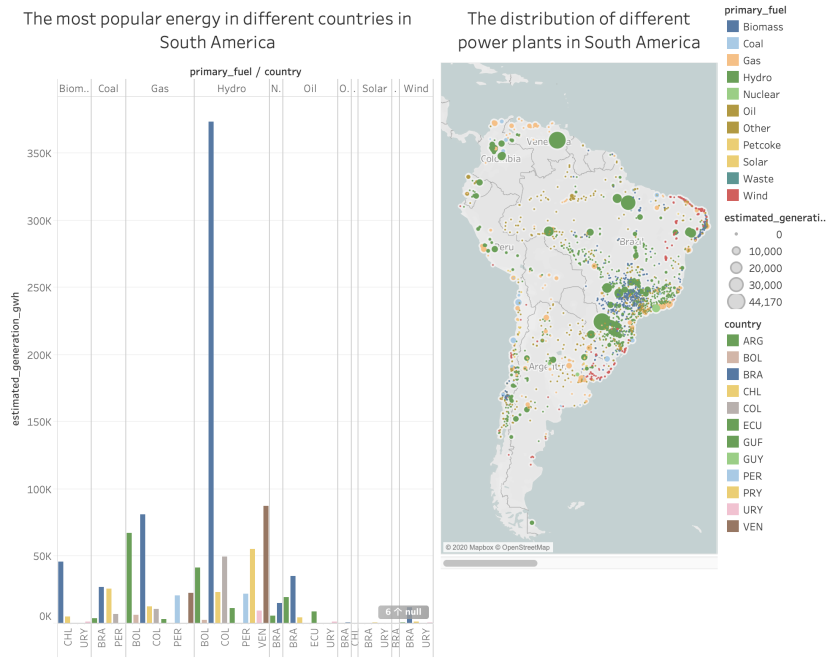
Visual mapping: Map Size – estimated_generation_gwh, Color – type of energy,
X Axis – Latitude, Y Axis-- Longitude, Mark – Circle, Label ( detail message )–Country and Power plant name.
Bar Chart Color – Country, X Axis – estimate_generation_gwh, Y Axis-- Country and primary_fuel.
Unique observation: Combined with maps and bar charts, we can see that hydro power is the most popular power generation mode in South America. Bra generates more than 350K of electricity through hydro power, and the second energy is natural gas. Some clean energy sources such as nuclear energy and solar power have not been well promoted in South America.
Data preparation: I categorize the national data into their respective continents and apply filters to show the South American information.
Question:
Does this description and designs make sense? If you have good design and idea, share with me thank you!