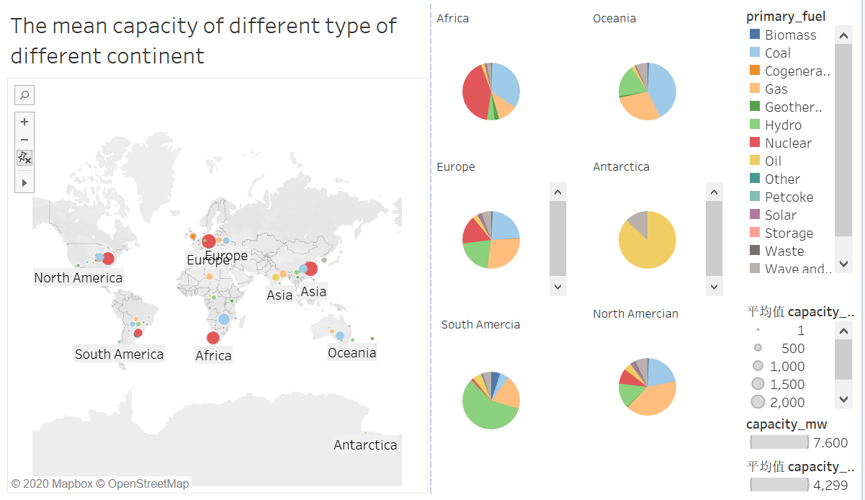
Visual Design Type: The mean capacity of different type pf different continent
Name of Tool: Tableau
Country: All of the countries in the dataset
Year: All of the years in the dataset
Visual Mappings: This visualization consists of a topographic map and six pie charts. In the topographic map, according to the six previously divided continental plates, each plate depends on the form of energy power generation. Different colors represent different types of energy. The size of the circle indicates different capacity. The larger the circle, the more capacity. Six pie charts represent different types of energy on different continental plates.
Unique Observation: As can be seen from the first figure, most of the continental plates rely on nuclear power and coal for power generation. It can be seen from the six pie charts that Africa mainly relies on nuclear power generation, Oceania mainly relies on coal for power generation, Europe mainly relies on natural gas for power generation, Oceania mainly relies on oil for power generation, South America mainly relies on geothermal energy for power generation, and North America mainly relies on natural gas for power generation.
Data Preparation: Different countries are classified according to their different continental plates. Then visualize their corresponding data.
690708