
Visual Design Type: Map + Line Chart
Name o f tool: Tableau
Country: South America continent
Years: All the years in the data sets
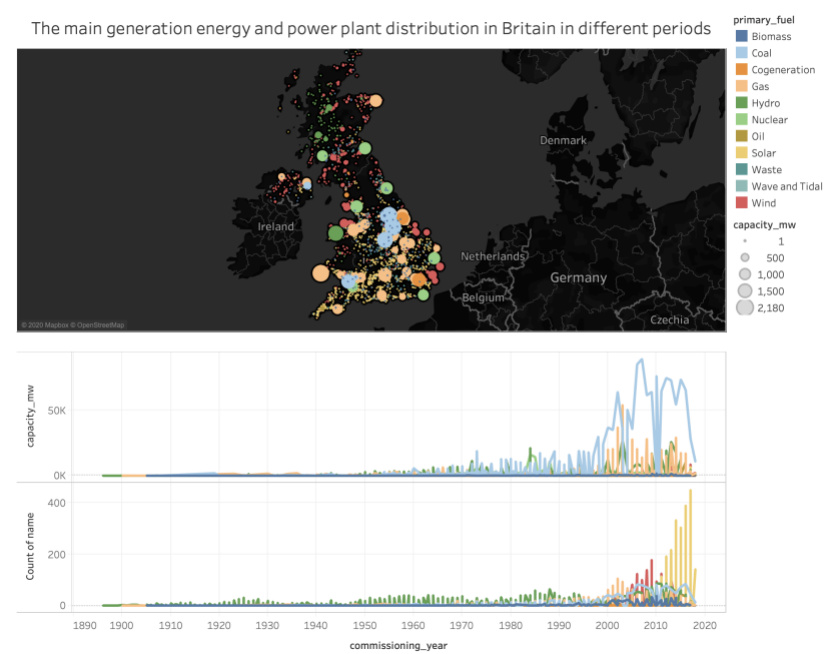
Visual mapping: Map Size – capacity_mw, Color – primary_fuel , X Axis – Latitude, Y Axis-- Longitude, Mark – Circle, Filter – Country(UK), Label – Name of power plant and Country.
Line Chart Color – Country, X Axis – commissioning_year, Y Axis – The number of power plants and capacity_mw.
Unique observation: In this design, the map mainly shows the distribution of different energy power plants in the UK. Combined with the line chart, we can find that before 1990, most of the power plants in the UK were hydro power plants, and natural gas and wind power plants dominated from 2000 to 2008. After 2008, solar power plants have been promoted. But according to the generated power line chart, we can find that the UK still needs to rely on coal-fired power plants to generate electricity to meet the domestic energy demand.
Data preparation: I use the filter to remove the null value in the year data to avoid its impact on the generation of statistical charts. On the other hand, I use the count function to calculate the number of power plants with different energy sources established in the UK in different time periods.
Reference: McCosker, A., & Wilken, R. (2014). Rethinking ‘big data’as visual knowledge: the sublime and the diagrammatic in data visualisation. Visual Studies , 29 (2), 155-164.
Question:
Does this design make sense? Is there anything that needs to be improved? If you have good design and ideas, please share with me, thank you!