Hi,
I am a student at Swansea University, learning Data Visualisation. I have been tasked with creating some visualisations using the GPPP dataset. This is one of my attempts. I would like to improve upon the clarity. Thank you in advance!
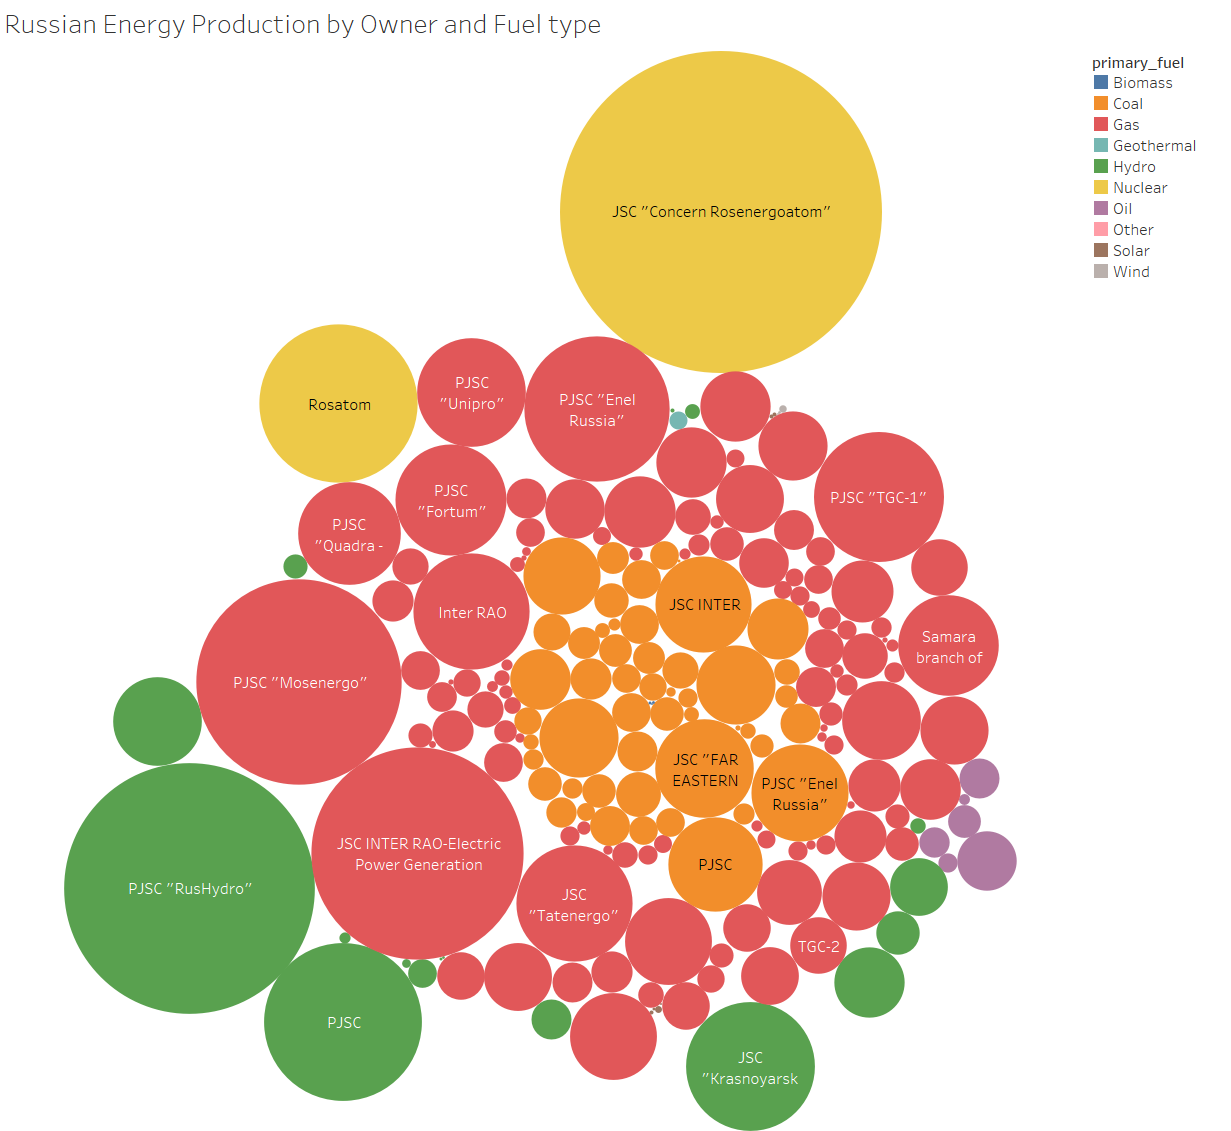
Data set:Global Power Plant Database - Datasets - WRI ODP
Visual Design Type : Packed Bubbles
Name of tool : Tableau
Country : Russia
Year : 2014
Visual Mapping :
- Colour : Primary_fuel
- Text : Owner
- Shape : Circle
- Size : Estimated generated electricity relative to the total production of Russia.
Unique Observation : The majority of the energy comes from many different companies who use Gas as a resource. The amount of energy produced by the use of coal, hydro and nuclear is very similar. There is a lot of competition between Gas and Coal companies yet there are only two companies that use Nuclear fuel.
Question :
- Are the colours suitable enough and clear to understand?
- Should I avoid having text In this type of visualisation?
- Is there a better way to convey the difference in number of companies based on the fuel they use?