Hello, I study at Swansea University and have been tasked to create data visualizations for the global power plant database (GPPD). Global Power Plant Database - Datasets - WRI ODP
I have come on here to ask how could my visual design be improved?
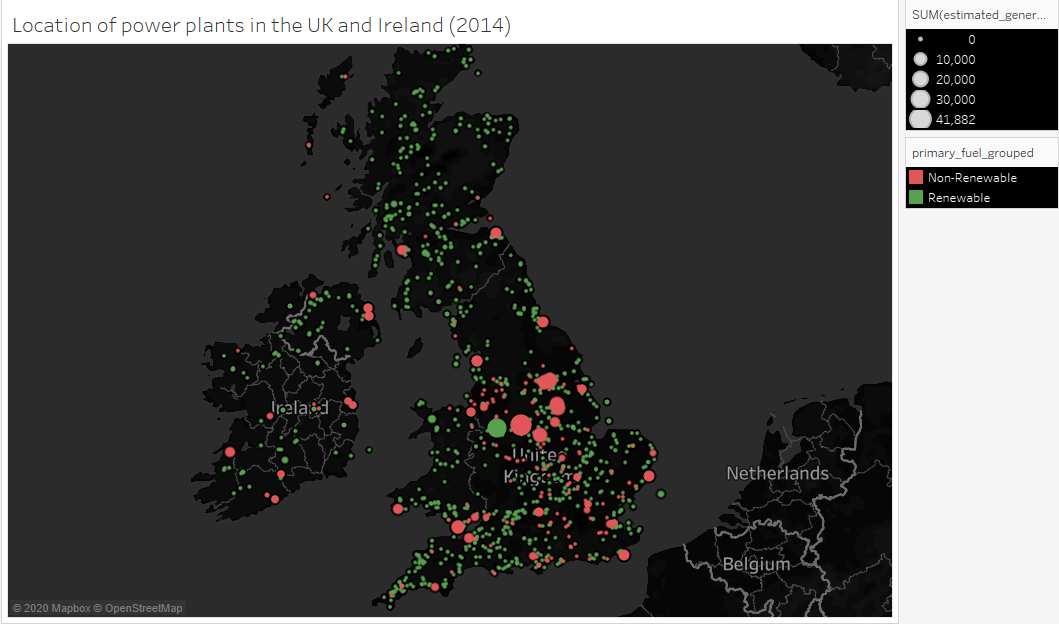
Image :
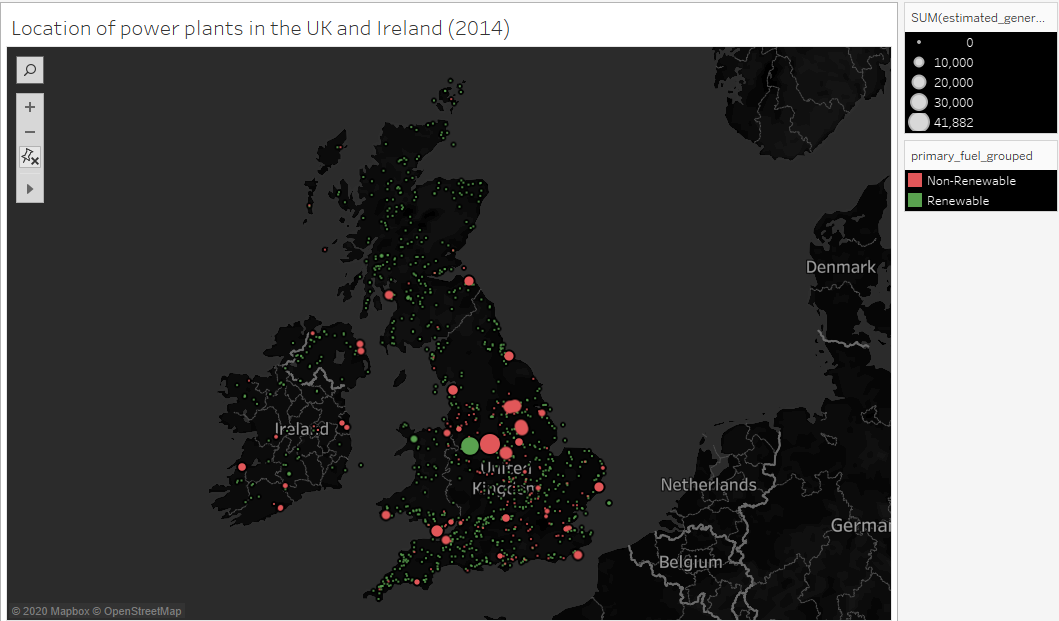
Visual Design Type : Digital (Symbol) Map
Name of Tool : Tableau
Country : United Kingdom, Ireland
Year : 2014
Visual Mappings :
Column: Longitude (generated)
Row: Latitude (generated)
Marks:
Detail: country_long
Detail: AVG(longitude)
Detail: AVG(latitude)
Detail: wepp_id
Colour: primary_fuel_grouped [Renewable, Non-Renewable]
Shape: Sum(estimated_generation_gwh)
Unique Observation :
There is many more renewable power plants throughout the UK and Ireland but they produce a significant amount less gwh than the non-renewable sources. The spread of renewable power plants can be seen along coastlines and throughout most of scotland which can be explained due to wind and tidal energy that can be utilized with these power plants. Larger, non-renewable power plants are mostly seen in the center of the United Kingdom as this is where many populated cities are.
Data Preparation : primary_fuel was grouped into renewable and non-renewable. Null values were also removed.