Packed Bubbles | China Primary Fuels

Dear all,

I’m studying at Swansea University Computer Science and I’ve been asked to produce some visualisations for global Power Plants. Please find below one of my visualisations and do feel free to add any comment.

Thank you.

Image:

Description

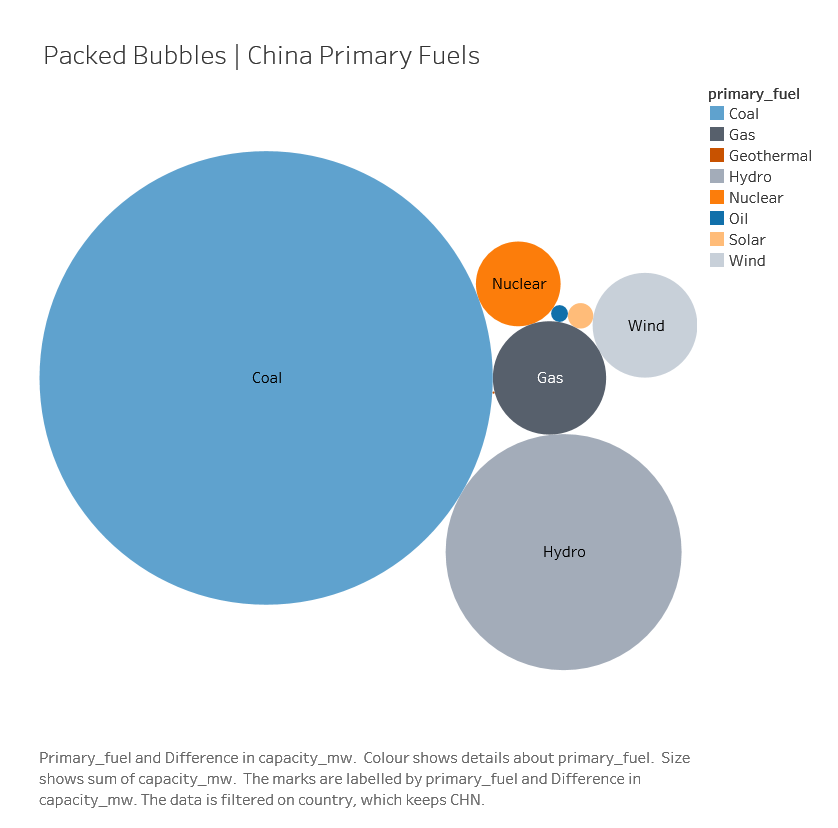
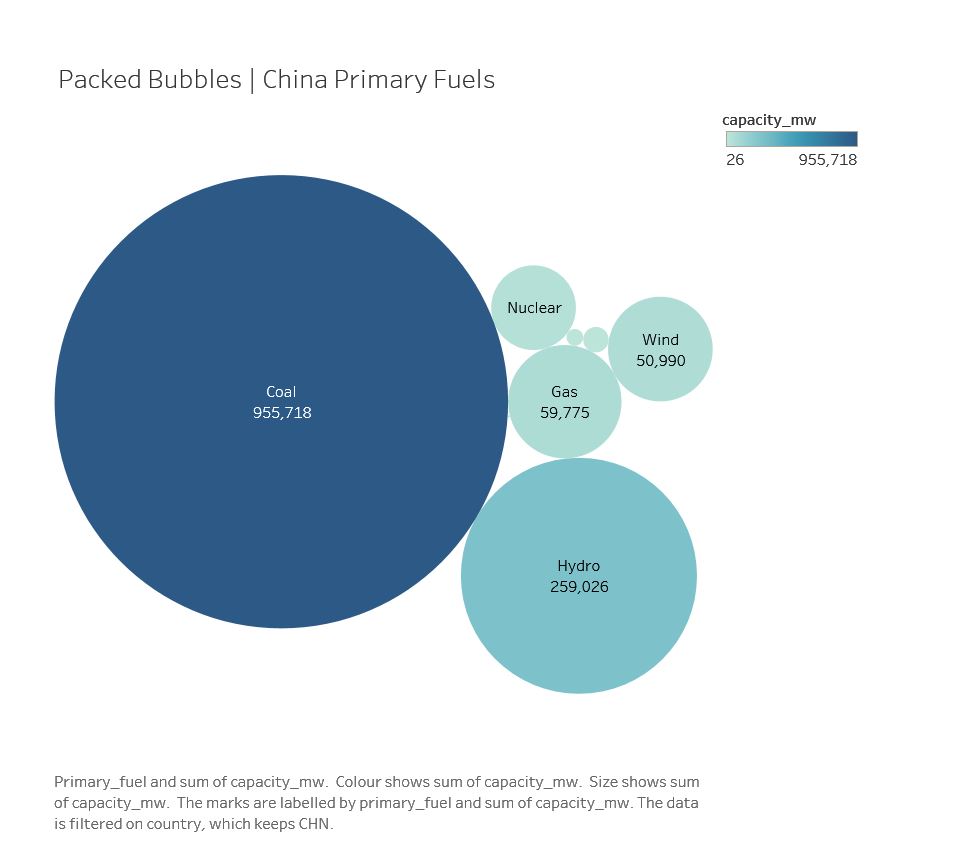
Visual Design Type: Packed Bubbles

Name of Tool: Tableau

Country: CHN

Year: All years of the dataset

Visual Mappings:
: * colour: colour mapped the Primary source of energy in China.
: * shape: each circle represents a type of Fuel
: * size: the size of each circle is based in the Capacity Produced from the specific Fuel

Unique Observation:
: From the visualization, we can see China’s Primary Fuels
i.e. we can see that China is producing the most its energy
from Coal, Hydro and Gas.

Data Preparation:
: Transforming the CSV file to the XLSX file

Source : http://datasets.wri.org/dataset/globalpowerplantdatabase

Questions:
Do you understand what the visualisation shows?
Is there any other visualisation map type more suitable for this case?
Is the colour map optimal?
Should I add any additional label?

Q1: Yes. This is a common form of infographics. It is easy to understand, except that the colour seems to represent capacity (same as size), rather than different sources. One can use two visual channels for the same variable. The redundancy is usually for the purpose of error-detection and correction by the viewers themselves.

Q2: I believe that part of course objective is for students to explore different visual designs and compare them. You can certainly consider to use bar chart, pie chart, treemap, and if there is a primary source variable, parallel coordinates plot.

Q3. For capacity, it is OK. For primary sources, I guess that it is a nominal variable. Using a discrete categorical colour map will be better.

Q4. Perhaps one can observe easily that two circles do not have any labels, and there is nothing about primary sources in the visualization. There is definitely some scope for improvement.

Thank you for the prompt reply. Maybe this visualisation is better?

Using a categorical colormap, together with its legend, certainly helps the two small circles. I know that Swansea has a few very good VIS experts and your course must have covered the design of categorical colormaps, and mentioned tools such as ColorBrewer. There is certainly some scope to improve the colormap here. You may also find some useful tips from reading other color discussions at VisGuides.