
Guideline: Hai all, I am a student from Swansea University. I have an assignment related to data visualisation, and I just learn how to make good data visualisation using Tableau. I am attaching an image of visualisation that I had made, this is not the best visualisation, and I am still working to make it better.
Source: http://datasets.wri.org/dataset/globalpowerplantdatabase
Question:
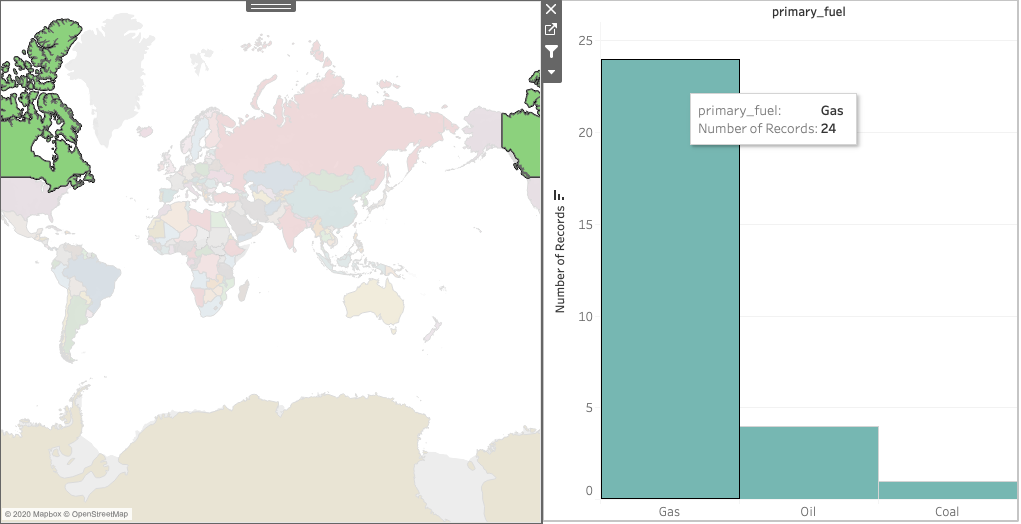
The visualisation aimed to give an overview of all of the primary fuel in each country. Here I use the country as a filter then the bar chart will show the number of the power plant from it. Questions:
- Do you guys think is it a good colour selection?
- What kind of mark and channel should I use to make it better?
Thank you for your time to read and comment.