Source: Nasa Fire Map - NASA | LANCE | FIRMS
Question:
Hello Everyone,
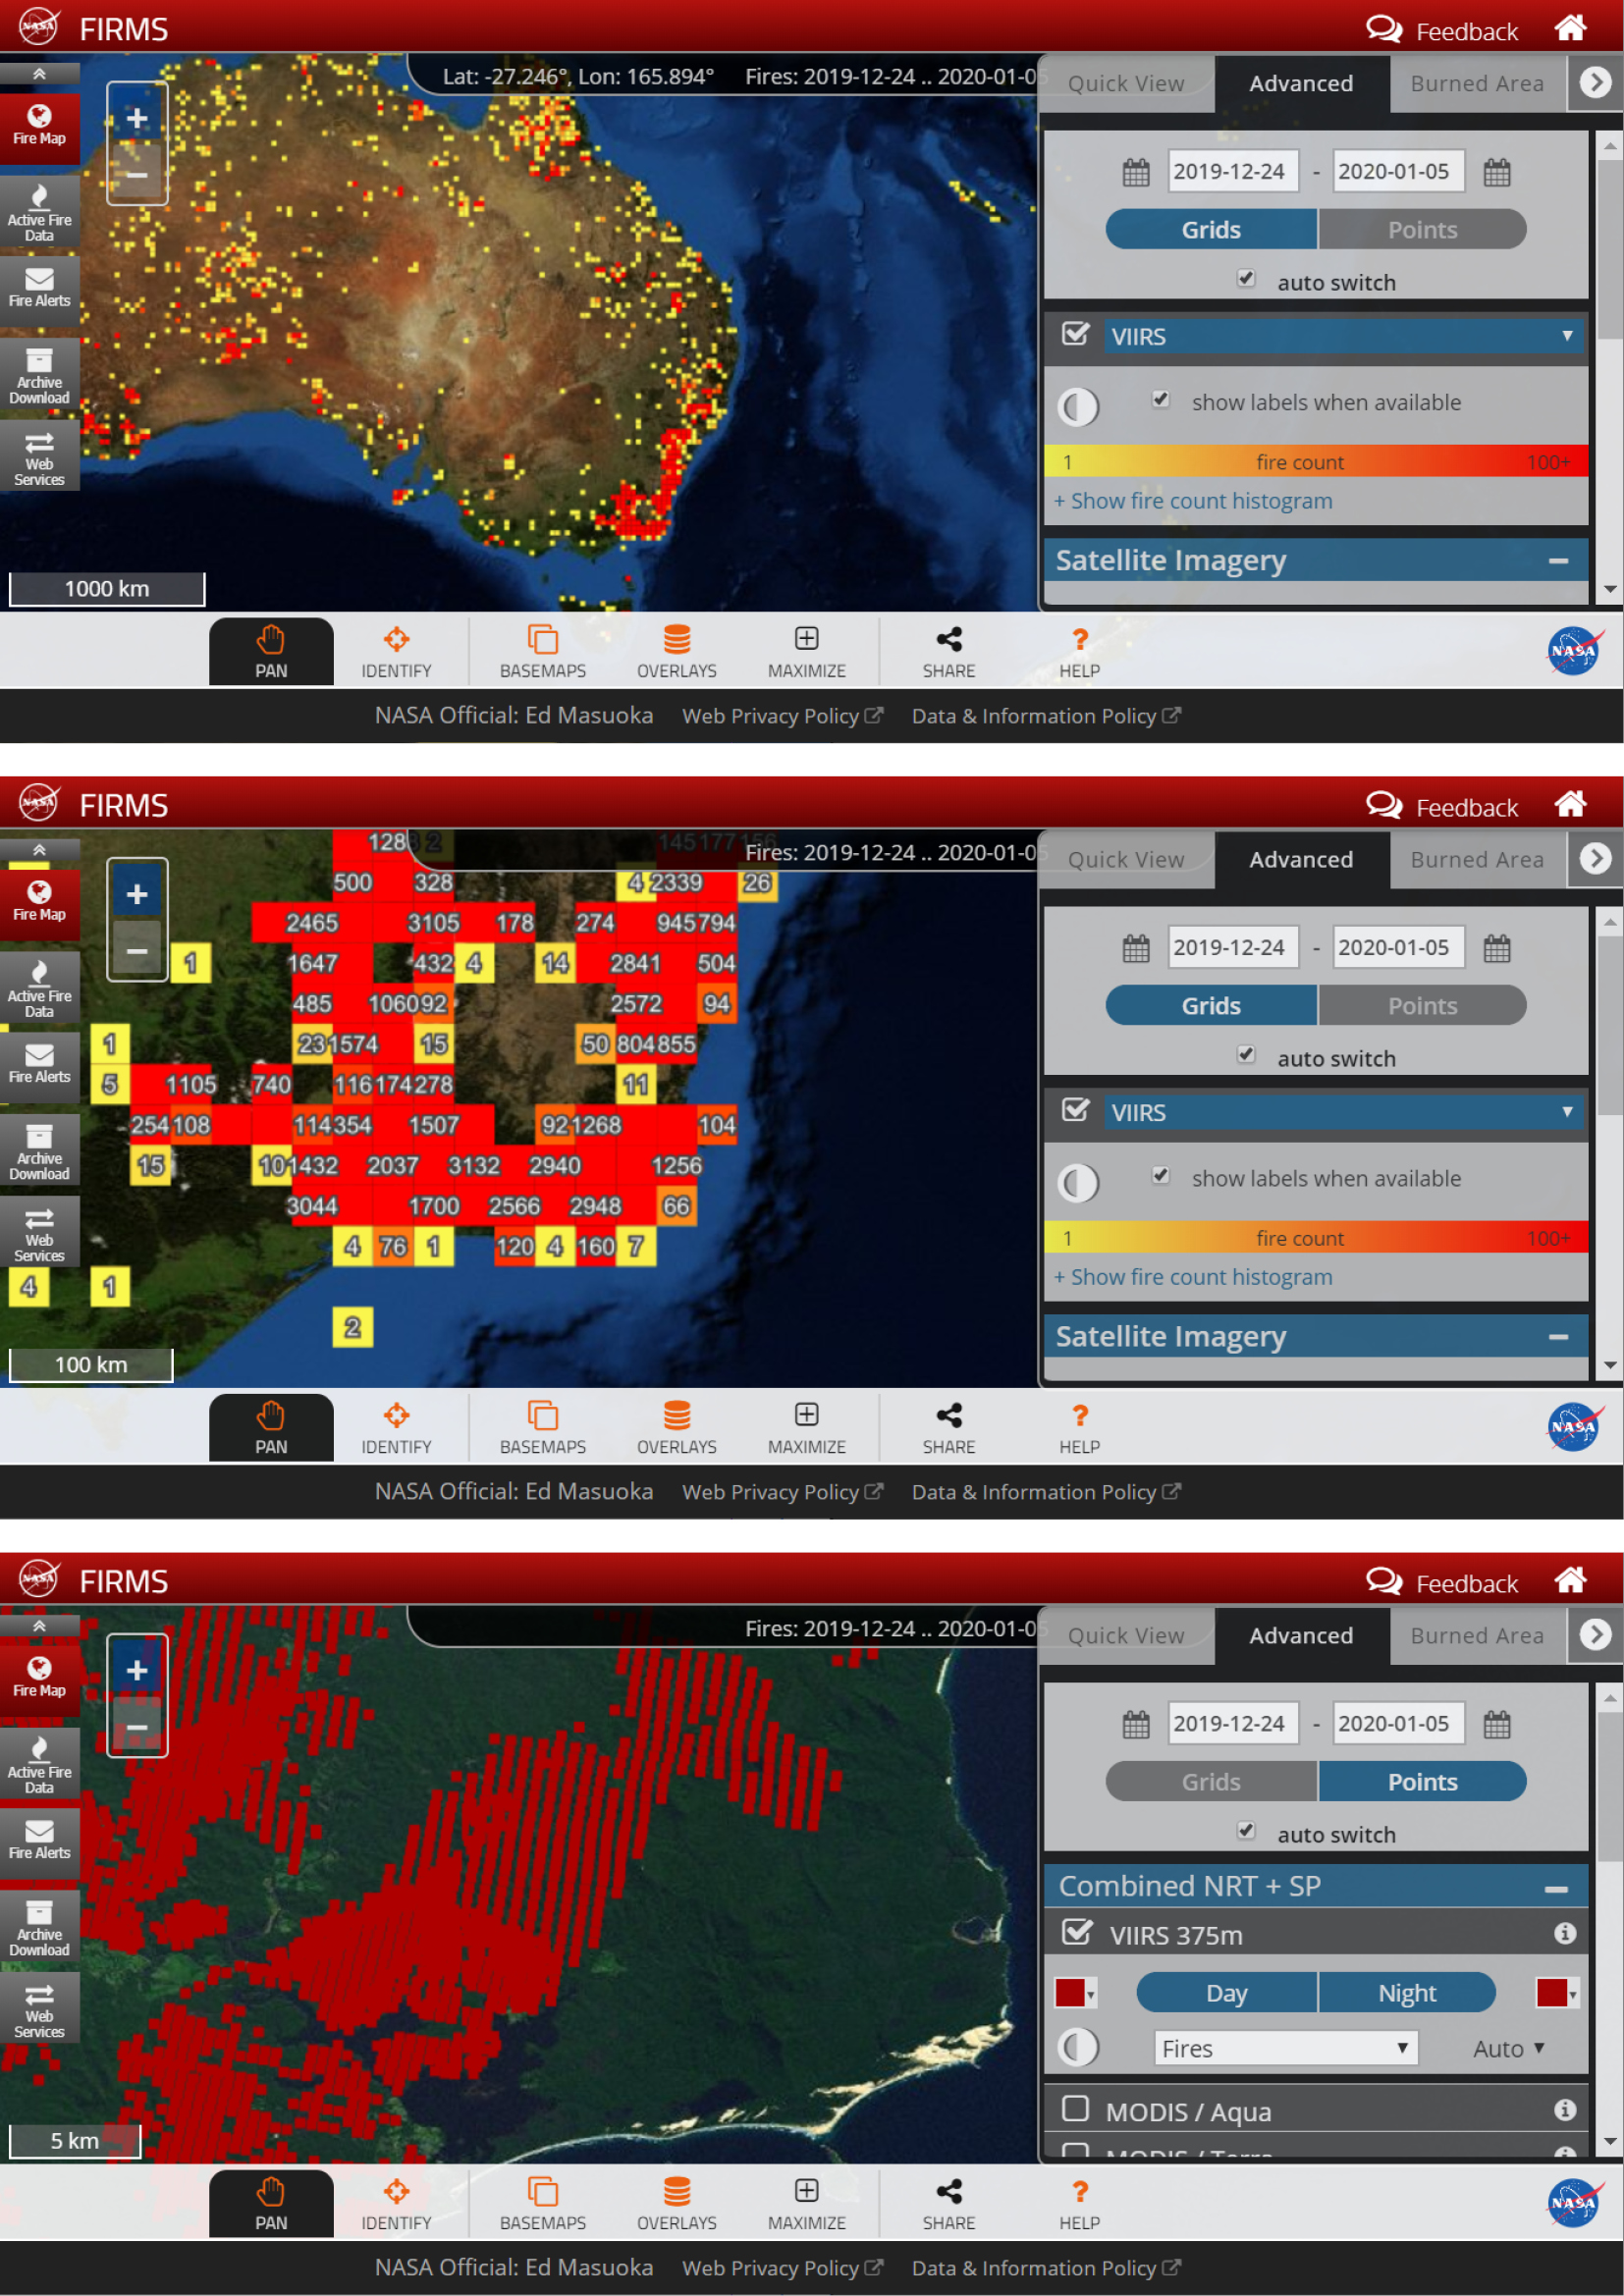
Due to the tragic nature catastrophe in Australia, I did some research and wanted to gather some information about the extent of the fire. Soon I found a map created by Nasa. It is an interactive map and yourself can change a few parameters due to the visualization and its design. First, I changed from points to the grid because the points did not have different colors regarding the intensity of the fire. The grid does a better job.
The next thing I noticed is that when you zoom in, it reveals more information until a point where the grid disappears. Here are the pictures to demonstrate what I mean:
I figured out that you can change the base maps to the following mods:
- Blue Marble
- Word Imagery
- Streets
- Topographic
- Dark Gray
- Light Gray
Example Street: NASA | LANCE | FIRMS
I had a look at all of the different modus but I was wondering what would be the ideal base map from which I could choose? Or do you have an idea that is not listed in the options? If so, in which program would you edit the visualization?
Thank you in ahead and Happy New Year!
Best wishes
Celine