
Hi all ! I have created a visualization using the below referenced data bases. It highlights issues about the localisations of nuclear plants in Japan.
Image:
Visual Design Type : Digital map and column chart
Country :Japan
Year: End of the 20th century and the 21st century
Visual Mappings
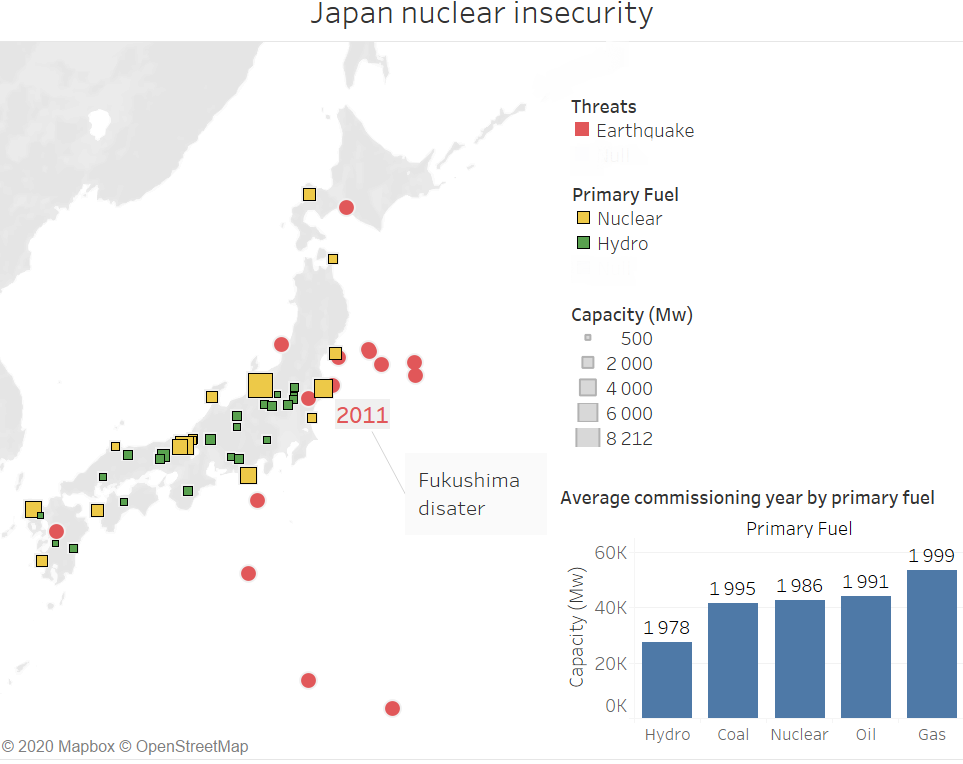
•mapping 1: On the map, plants are represented by a square and earthquakes by a red circle. Only earthquakes which have stricken Japan over the last ten years are on the map. For plants, only those which are part of the two most fuels used in Japan are represented. Moreover, plants are depicted by their primary fuel and their size shows their capacity.
•mapping 2: A column chart supplements the map. The capacity of plants grouped by fuels are indicated with their average commissioning year.
Unique Observation: It is well known that Japan is struggled with the earthquakes’ issue. Nuclear plants are located near the sea which jeopardize them in case of tsunami, such as in 2011 with the Fukushima disaster. As we see on the chart, Japan tries to diversify its power generation. However,the Japanese nuclear park is ageing and I think, to avoid an other disaster, it would be an interesting idea to phase out nuclear energy.
Data Preparation: Because of the lack of data on nuclear plants in the data set, I had to find their capacity and their commissioning year. Moreover, several nuclear plants have been closed after the Fukushima disaster and this was not taking into account in the database. That is why, I amended the data to have the right figures. Finally, I mainly used Wikipedia to have access to the earthquakes’ localisation.
Source :
wikipedia : List_of_earthquakes_in_Japan
wikipedia : Nuclear_power_in_Japan
Question:
Do you think my visual is relevant to represent nuclear insecurity in Japan ? Would you have added other data or made different choices ?
Thank you in advance.
Baptiste