
I have made this symbol map of pie charts using the Project Tycho dataset and selected 6 deadly infectious diseases.
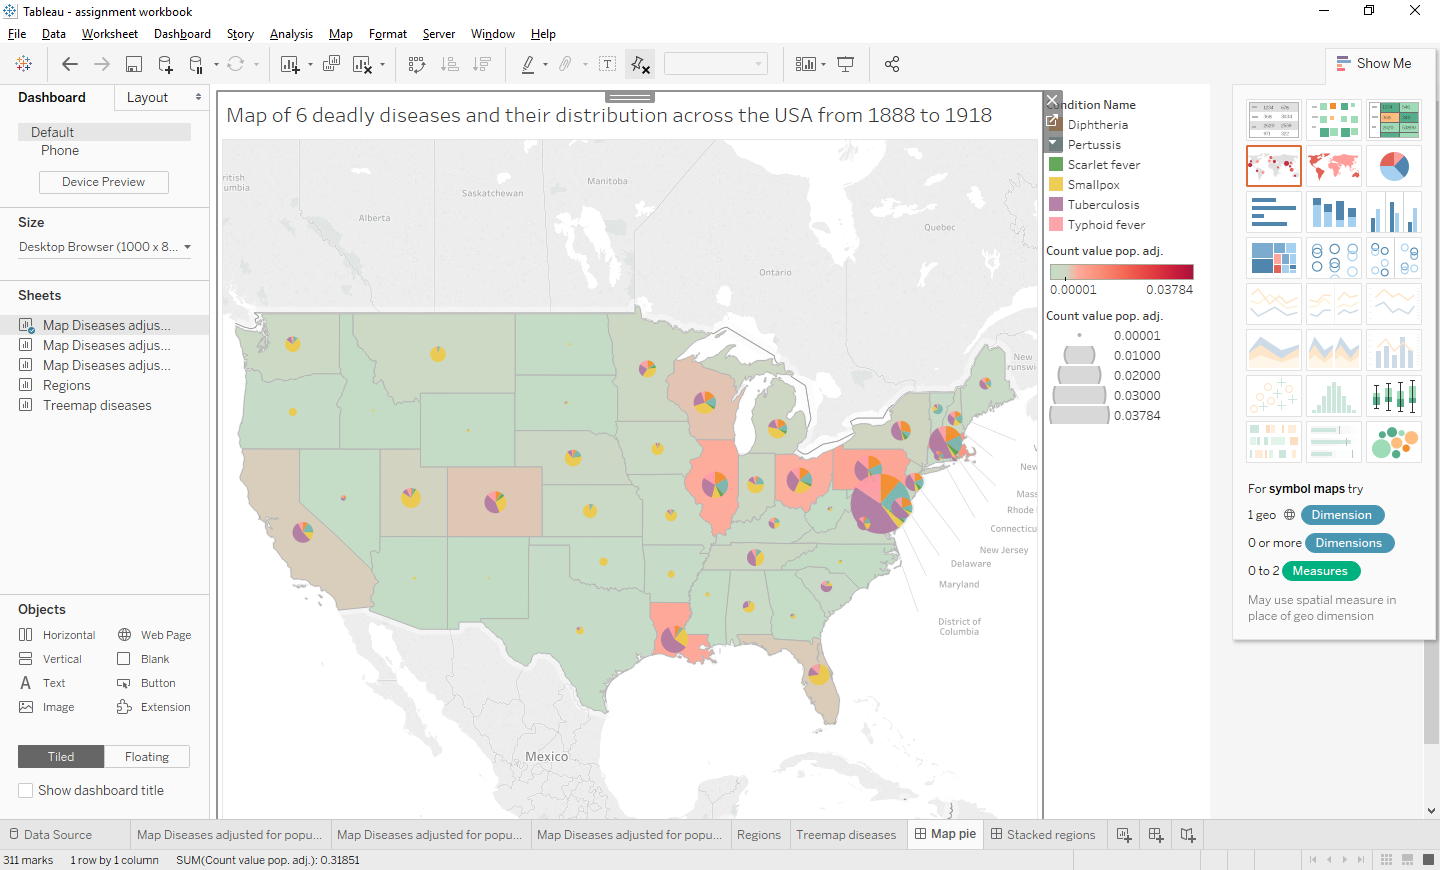
Type: Symbol map
Tool: Tableau
Country: United States of America
Years: 1888-1918 (population data: 1900)
Visual mappings:
State name (generated longitude & latitude)
Population
Count value Pop. Adj.
Condition name
Observation:
From this data, we can make a few observations. Firstly, we can see that even when adjusted for population, the densely populated areas are far more susceptible to infectious diseases, for example, the east coast (especially New York, Massachusetts, and Philadelphia) the count value is higher than everywhere else. Of course, this is likely due to the dense populated enabling the fast spread of infectious disease. You can see that Texas, Nevada, and New Mexico have near non-existent infectious disease issues when compared to the east coast states. As well as this we can see that the densely populated areas on the east coast have very little Small Pox compared to the rural areas, where Small Pox is the main problem.
Data preparation:
I had to download a dataset of historic US state populations and link them to the Tycho dataset in Tableau which allowed me to adjust the data for population. Without this, the states with the highest population would have almost always had the highest disease cases.
Question:
I’m wondering whether this chart type is useful when compared to a traditional stacked bar chart (with the state names across x-axis and colours indicating diseases) as a bar chart like this would likely be easier to read but it would be very long. We can see this pie chart symbol map combination being used as far back as 1858. [1]
Personally I think this format works better than a bar chart for this data because there are 52 states; too many for a person to properly take in at one time from a very long stacked bar chart - I think the direct links to their geographic location makes the data easier for a person to process.
References:
[1] No Humble Pie: The Origins and Usage of a Statistical Chart - Ian Spence
Journal of Educational and Behavioral Statistics, Vol. 30, No. 4 (Winter, 2005), pp. 353-368
DOIs:
Typhoid: 0.25337/T7/ptycho.v2.0/US.4834000
Influenza: 0.25337/T7/ptycho.v2.0/US.6142004
Smallpox: 0.25337/T7/ptycho.v2.0/US.67924001
Scarlet Fever: 0.25337/T7/ptycho.v2.0/US.30242009
Petussis: 0.25337/T7/ptycho.v2.0/US.27836007
Diptheria: 0.25337/T7/ptycho.v2.0/397428000
Thank you,
Morgan.