Hello, I hope my answer is helpful for you.
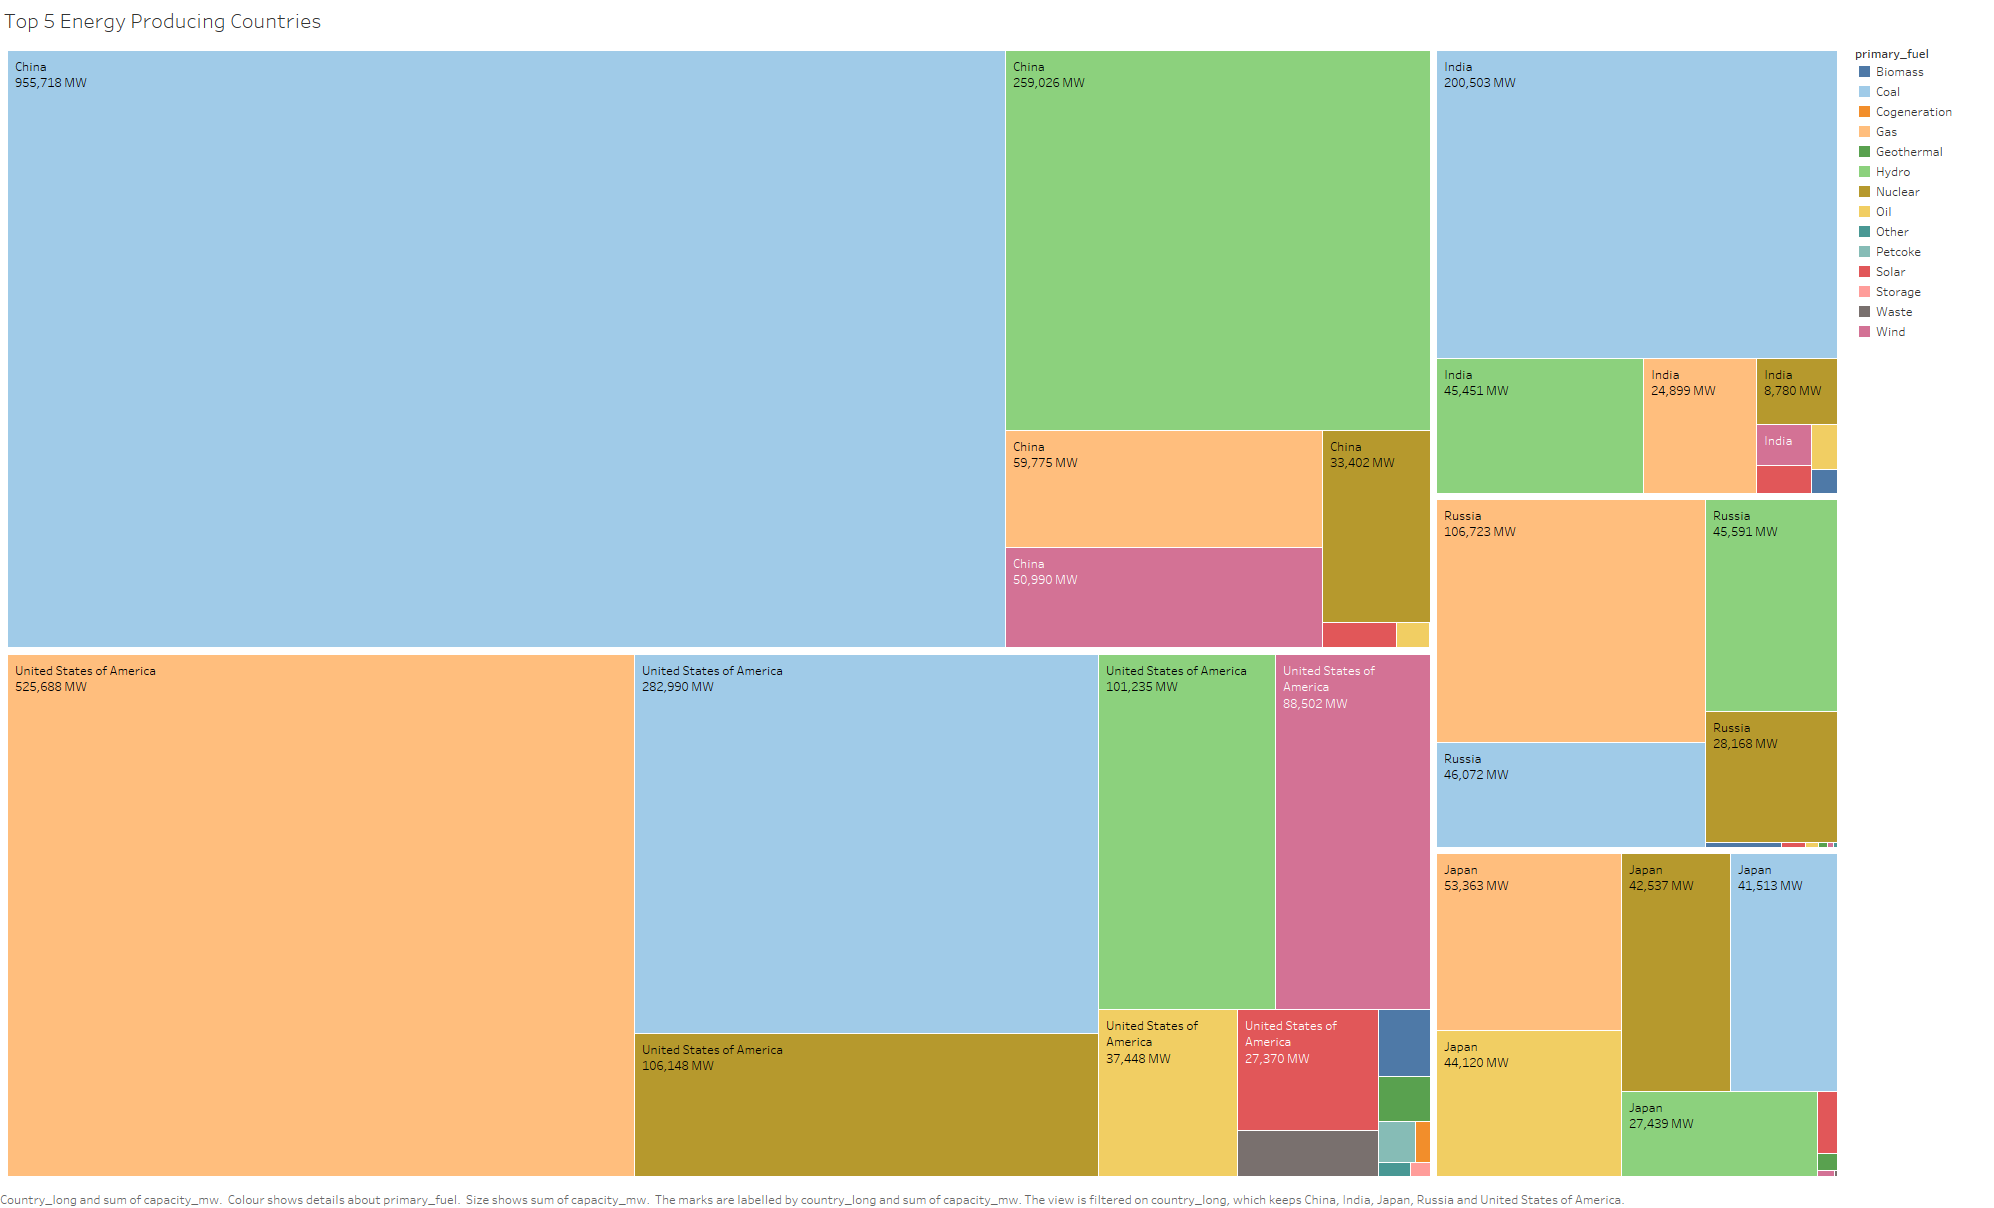
I’m wondering if my use of colour to denote primary fuel is understandable?
=> Well, it is not obvious to follow colors and what you want to represent in this plot because so much information is mixed in your treemap.
Does my visual design make sense?
=> Not really because it is hard to figure out what you intend in your visualization. You should break down information depending on your intention. The treemap has too packed data.
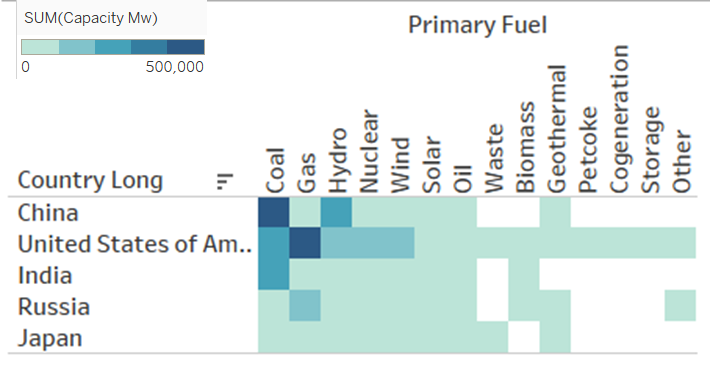
If you want to show the most fuel type of each country for detecting a trend roughly, you can try a heatmap with sorting by sum of Capacity.
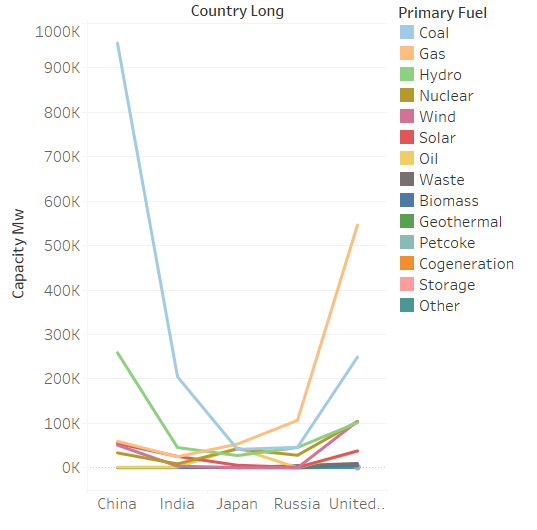
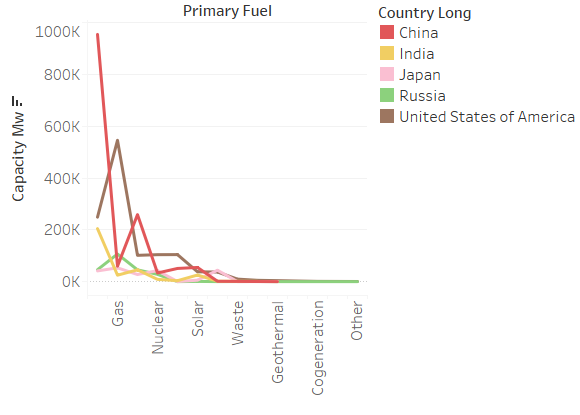
If you want to represent which fuel is dominant in countries, you can use a line chart. Then, you can easily observe a primary fuel trend depending on countries.
x-axis : Primany Fuel
y-axis : Capacity Mw
Color : Country Long
Is it easy to understand what information it is trying to convey?
=> No, I would like to suggest you a line chart instead of treemap since the treemap can not show trends well . Moreover, it is hard to compare quantities among variables.
When
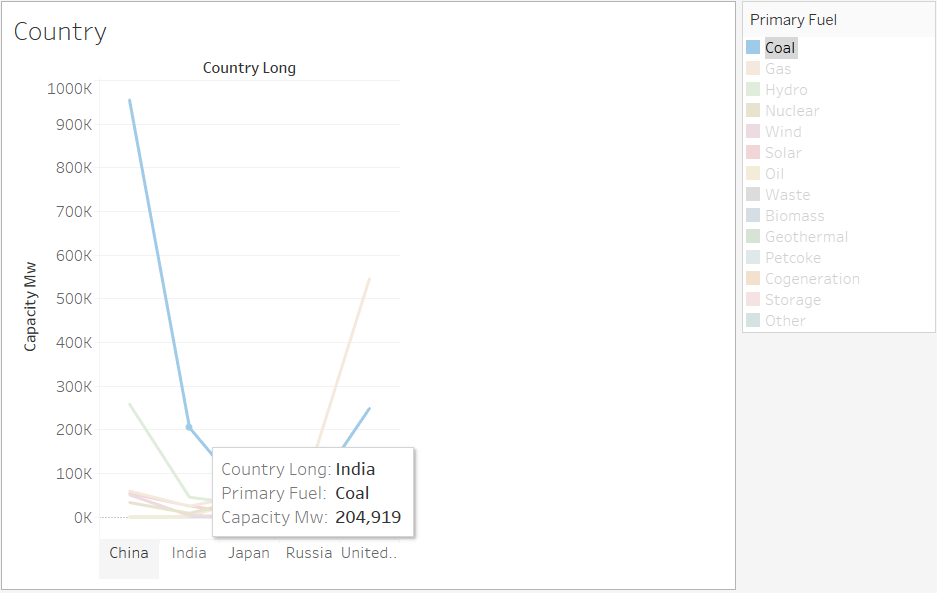
You can see a trend of primary fuel for each country.
x-axis : Country Long
y-axis : Capacity Mw
Color : Primany Fuel
If you want to see details of each graph, you can use the highlight function.
For example, you can press Highlight Selected Items => Coal. or just a label. Then, you can see each highlighted line. Plus, values of variables will be displayed when you put your pointer on the graph.
I uploaded my code on GitHub - ccocco1/open-source. I hope it is helpful to you.