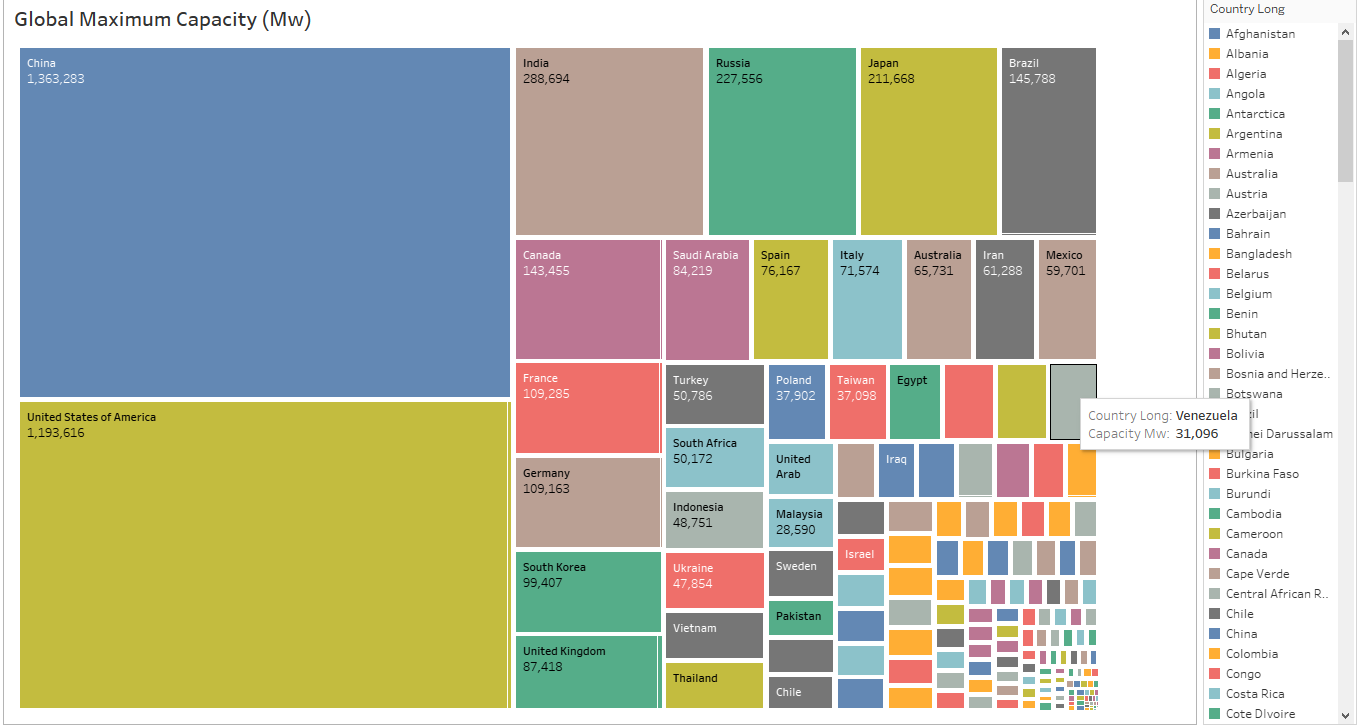
Guideline: *Greetings, thanks for taking the time out for your busy day to read my post. I have used Tableau to create a treemap to help illustrate the Global Maximum Capacity of each country worldwide
Visual Design Type: Treemap
Name of Tool: Tablaeu
Country: Global
Year: N/A
Visual Mappings:
Colour: Country Long
Size: Measure Values
Label: Country Long
Label: SUM(Capacity Mw)
Unique Observation: From this Treemap, it is very evident that the USA and China have the largest maximum capacity globally (Mw), with those two countries totaling to approximately 45% of the global capacity. At a glance, this isn’t too surprising considering the side and of the countries and their respective economies
Data Preparation: Filtered “Measure Values” to retain only the information we need, in this case being the maximum capacity
Source: * A Study on the Effectiveness of Tree-Maps as Tree Visualization Techniques : A Study on the Effectiveness of Tree-Maps as Tree Visualization Techniques - ScienceDirect*
Question:
Just a few general questions
Is there anyway in which I can improve my design?
Does the design convey the information clearly?
Is my design visually appealing?