The issue of dimensionality in charts is often ill-defined and resources contain conflicting information. Some might say that bar charts are two dimensional, because they display data from two variables, or at least so argues the documentation of the acl data analysis tool set.
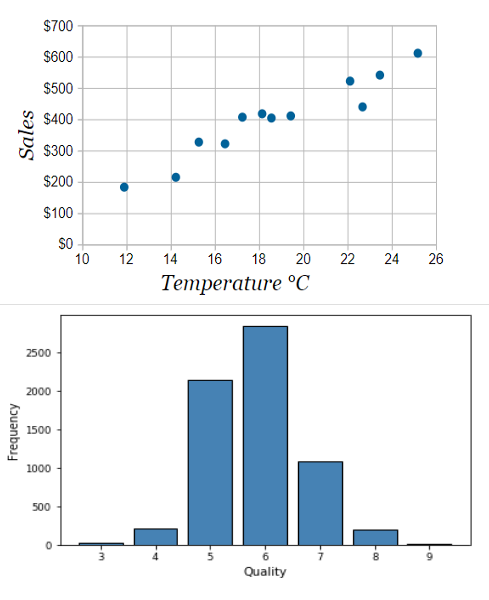
So lets try to squeeze the data from the scatter plot into a bar chart. Bar charts typically have a constant distance between bars (bins) and a constant width between each other. If the data in the scatter plot is not evenly distributed, or does not contain data with even distances, finding bars that fit this is next to impossible. It seems like in the conversion we have to forgo some dimension of the data.
I’d therefore argue that the difference between a bar chart and a scatter plot lies in the binning. Bar charts display data in bins with discrete categories, or in your example discrete quantities. This means that in the visualization the data on the x axis is not available in a continuous spectrum, but only in these discreet bins with a constant distance between each other. It is these discrete bins that give the dimensionality, while the y axis provides a measure, or length, to each of the bins. Since only one axis determines the dimension, we call this kind of visualization “one dimensional”. Similar terminology is also used here by Qlik another data analysis tool set. Higher dimensions can be added to the Bar chart by adding sub-binning, or sub-categories to each of the bars.
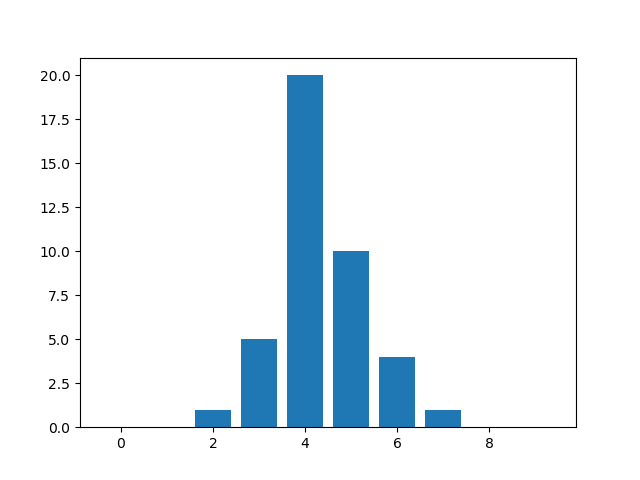
It might make sense to look at it from a raw data standpoint to get some understanding of the above. In theory a bar chart histogram can be encoded in the following way: [0,0,1,5,20,10,4,1,0,0], giving a measure for ten bins. This clearly one-dimensional data can be plotted in a bar chart without any further effort (here using matplotlib):
import matplotlib.pyplot as plt
import numpy as np
data = [0,0,1,5,20,10,4,1,0,0]
plt.bar(np.arange(len(data)), data)
plt.show()
This of course excludes any scaling on the x axis, but shows that a lot of bar charts can be generated from one dimensional data. Lastly I’d argue that the data on the y axis is often unit or dimensionless, which coming from physics usually means that it does not carry another dimension to the problem or visualization.
TLDR: It’s complicated, but bars have a discreet binning with constant distances between each other, which allows thinking of the displayed data as a one-dimensional array.