
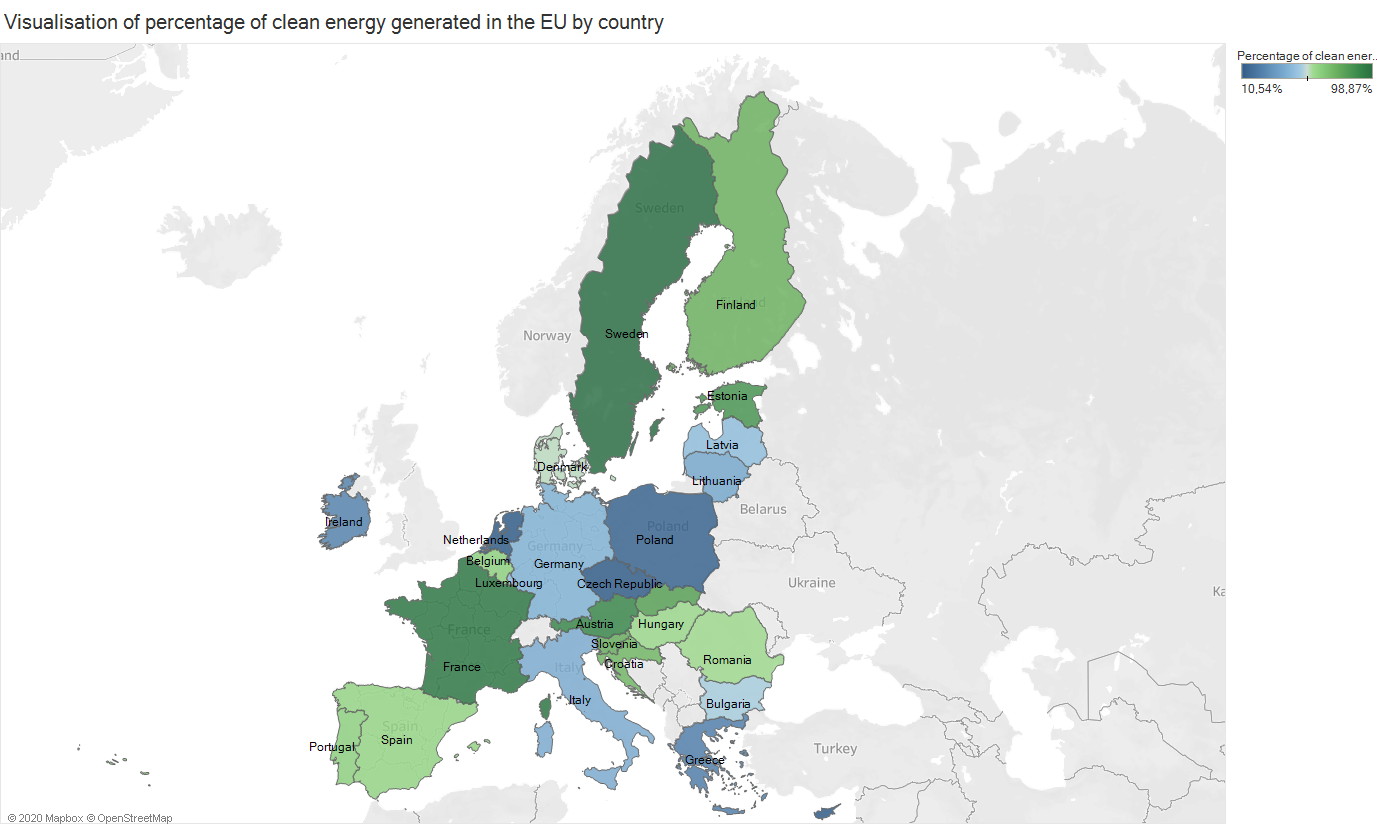
Choropleth map: The map visualises the percentage of clean energy generated in each of the countries in the European Union. The Map displays the percentage using a diverging color scheme. This is done to highlight the difference between the countries, but this is the place where my question lies.
Since the data is somewhat incomplete I have ignored cases with missing values for estimated generated power when deriving the percentage of clean power generated. I have calculated it by finding how many GWh are generated using fossil fuels and how many GWh are generated using renewable or less polluting sources.
Source of database: Global Energy Observatory, Google, KTH Royal Institute of Technology in Stockholm, Enipedia, World Resources Institute. 2018. Global Power Plant Database. Published on Resource Watch and Google Earth Engine;
URL of database: http://datasets.wri.org/dataset/globalpowerplantdatabase
Question:
My biggest concern is the colour choice. I experimented with using a single colour with varying saturation, but it didn’t convey the large difference between Poland and France, for example, the way I wanted it to. I instead opted for a diverging colour scheme as recommended in some relevant literature[1]. Another problem is the interaction between area and saturation that makes countries like France, Poland and Sweden look larger than they actually are, due to the high saturation, and thus more imposing. As with every map it is easy to understand by the general public, but trades off the use of area for conveying sometimes not very useful data like the borders and area of the countries concerned. How do I use colour here to both diminish the problem with the interaction between saturation and area and highlighting the countries that are exceptional on both ends of the spectrum?
[1] Brewer, C.A. and Pickle, L., 2002. Evaluation of methods for classifying epidemiological data on choropleth maps in series. Annals of the Association of American Geographers , 92 (4), pp.662-681.
