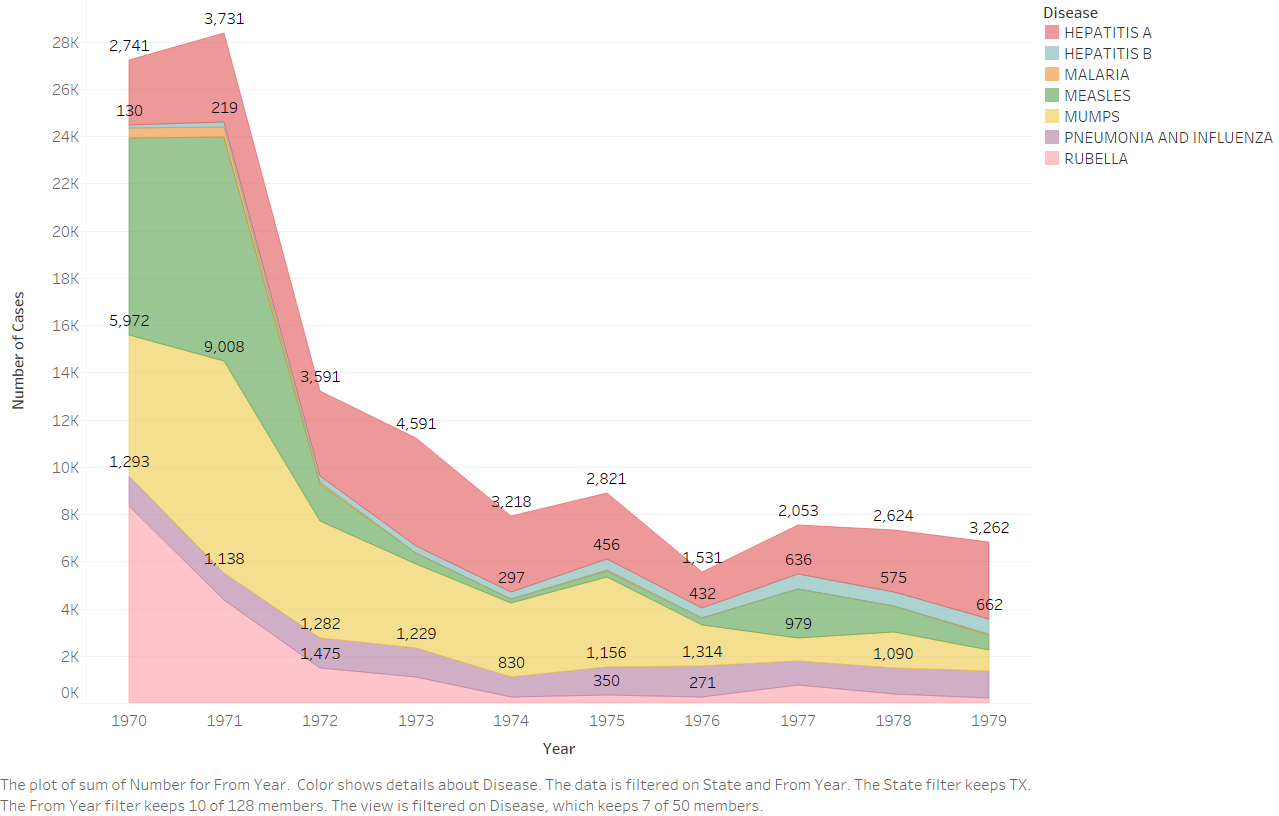
I have created an area chart using Tabeau for my Data Visualization class, and it shows the number of cases of 7 different types of diseases in Texas in the 1970’s. Each disease is represented by a different color in the chart and each point indicates the number of accumulated disease occurrences up to that point during the designated year. The data comes from Project Tycho and I selected these diseases by narrowing down the data to only diseases that have recorded cases throughout the 1970’s in Texas.
(Citation: Willem G. van Panhuis, John Grefenstette, Su Yon Jung, Nian Shong Chok, Anne Cross, Heather Eng, Bruce Y Lee, Vladimir Zadorozhny, Shawn Brown, Derek Cummings, Donald S. Burke. Contagious Diseases in the United States from 1888 to the present. NEJM 2013; 369(22): 2152-2158.)
My question is, how should the chart be labeled? I thought showing the height, or number of disease cases, at each point would be a good way to help communicate the data, but because of spacing it is only possible to show some of the points. Without the labels, though, I think the values can still be easily determined, but the chart looks very plain. There’s a picture of the chart with the limited points labeled below.

Thank you!
Hannah
