Hey guys,
I have created an area chart that conveys the increase of the generation capacity over the years and the proportion of each fuel type, and I would just have a couple of quick questions about it.
Data Description:
Image:
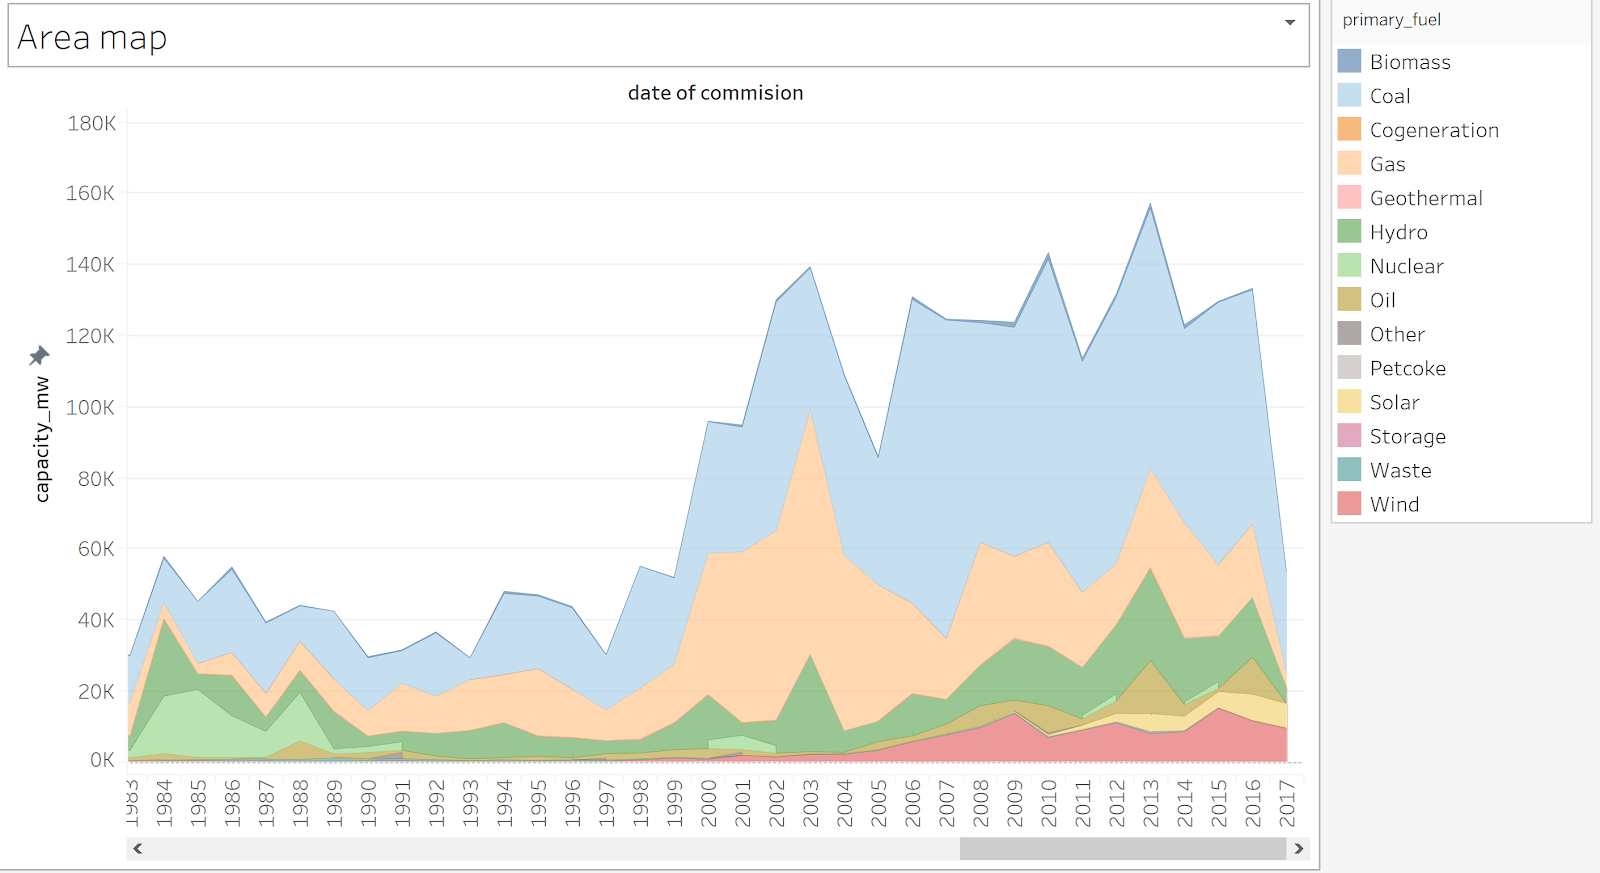
Visual Design Type: Area chart
Name of Tool: Tableu
Country: Global
Year: 1983- 2017
Visual Mappings: x axis represents the year, and y represents the total global yearly capacity_mw. Each colored area represents a different fuel.
Unique Observation: Coal still produces massively more energy overall than any other fuel type. What is also interesting is that nuclear power has dips in usage. Between 2002 and 2011 there was almost no energy produced by nuclear power, although it is one of the most effective ways to produce energy; also to note is that its usage has fallen dramatically after 1989. Also to note that from 2000 onwards, wind power plants produce more and more of the total energy.
Data Preparation: The null years have been filtered out, since they have the majority and would skew the graphic negatively. Also, the years have been formatted to represent a date (month and day has been defaulted to 1/1), since they were a string in it’s CSV format
Source : Global Power Plant Database - Datasets - WRI ODP
Question :
Is there any way to increase the readability of fuel types that do not produce as much as other types? (e.g. nuclear)
Is the choice of the colour scheme appropriate?
Any better way to represent the data or to improve it?