Guideline :
Visual design type: Treemap
Name of tool: Tableau
Country: United States of America
Year: 2001-2011
Data Prepartion: No extra data preparation was taken
My question is the treemap above give you enough information or not ?

Guideline :
Visual design type: Treemap
Name of tool: Tableau
Country: United States of America
Year: 2001-2011
Data Prepartion: No extra data preparation was taken
My question is the treemap above give you enough information or not ?
Hi nawaf, thanks for sharing your Treemap Diagram on here!
Personally, I found it rather difficult to grasp the hierarchy in the data underlying your plot at first sight. Does each square of a color represent 1 of the 50 states of the USA? If so, how come there are 51 squares in the “Pertussis” area and 50 in the “Hepatitis A” area?
The main information I got out of your plot was a feeling for the ratio of the listed diseases in the USA in-between the years 2001 - 2011 in the sense that “Pertussis” was the most common measured disease whereas “Rubella” occurred the least. Is this the message you tried to get across with your plot? If so, I do not understand why you decided to go for a treemap. You could have packed each disease (color category) into a bar, leading to a simple Bar-Chart: https://ibb.co/mcsBn27
As to answer your question “if the treemap gives me enough information”; In terms of a treemap I have to answer this with a “no”, as with your current treemap plot you’re not making use of many a feature/advantage a treemap holds:
Use text labels for the individual squares in order to add distinguishability to the different states. This will also help the viewer to understand what kind of data he is looking at and adds a new dimension of information to the plot, for the viewer can now compare the ratio of diseases per state. This will not lower the data-ink-ratio of your plot for state labels add relevant information to this plot.
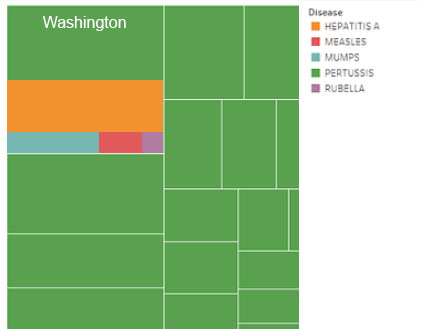
The current hierarchical representation choice (display all 50 States for each disease) leads to Data that can’t be visually perceived (Measles, Mumps and Rubella leaves are extremely small). To solve this issue, I see two different approaches, the first one being adding interactive tools to your plot such as a magnification functionality or a drilldown functionality that lets the user drill down on individual disease Categories. The second approach I can think off is a restructuring of the treemap as a whole, displaying each of the 50 States only once but adding a hierarchical depth to each state corresponding to the ratio of diseases measured in each specific state. I’ve created an example in which I visualized the ratio of diseases for one state (Washington) to give you an idea how I imagine it to look like:

This will get rid of some of the tiny leaves (“Mumps”, “Measles” and “Rubella”) you’re currently facing in your plot while still including the least spread diseases such as “Rubella”. Please keep in mind that it might not be possible to prevent your treemap from having small leaves and that it might not be possible to lable them because of their small size. That is one of the main reason why I would highly emphasize to go for a dynamic visualization approach when creating a treemap instead of a static approach.
In order to add more depth in terms of geographical information, you might also consider enhancing the above mentioned approach by adding a top-layer hierarchy to your data set, separating States into “East” and “West” States: https://ibb.co/hyWxqSp
To sum up:
Deciding which path you’ll be taking from here on mainly boils down to the message/information you want to communicate through your plot. If you decide to stick with a treemap plot I would consider enhancing your current plot with some of the above mentioned ideas in order to justify your choice of using a treemap. Otherwise, you might consider going for a more simplistic visual representation such as a bar-plot.
Good luck and kind regards
C
Sources (as a new user I am not allowed to post any more links so I had to remove the following source links)
http://www.cs.umd.edu/hcil/treemap-history/
https://datavizcatalogue.com/methods/treemap.html