Guideline:
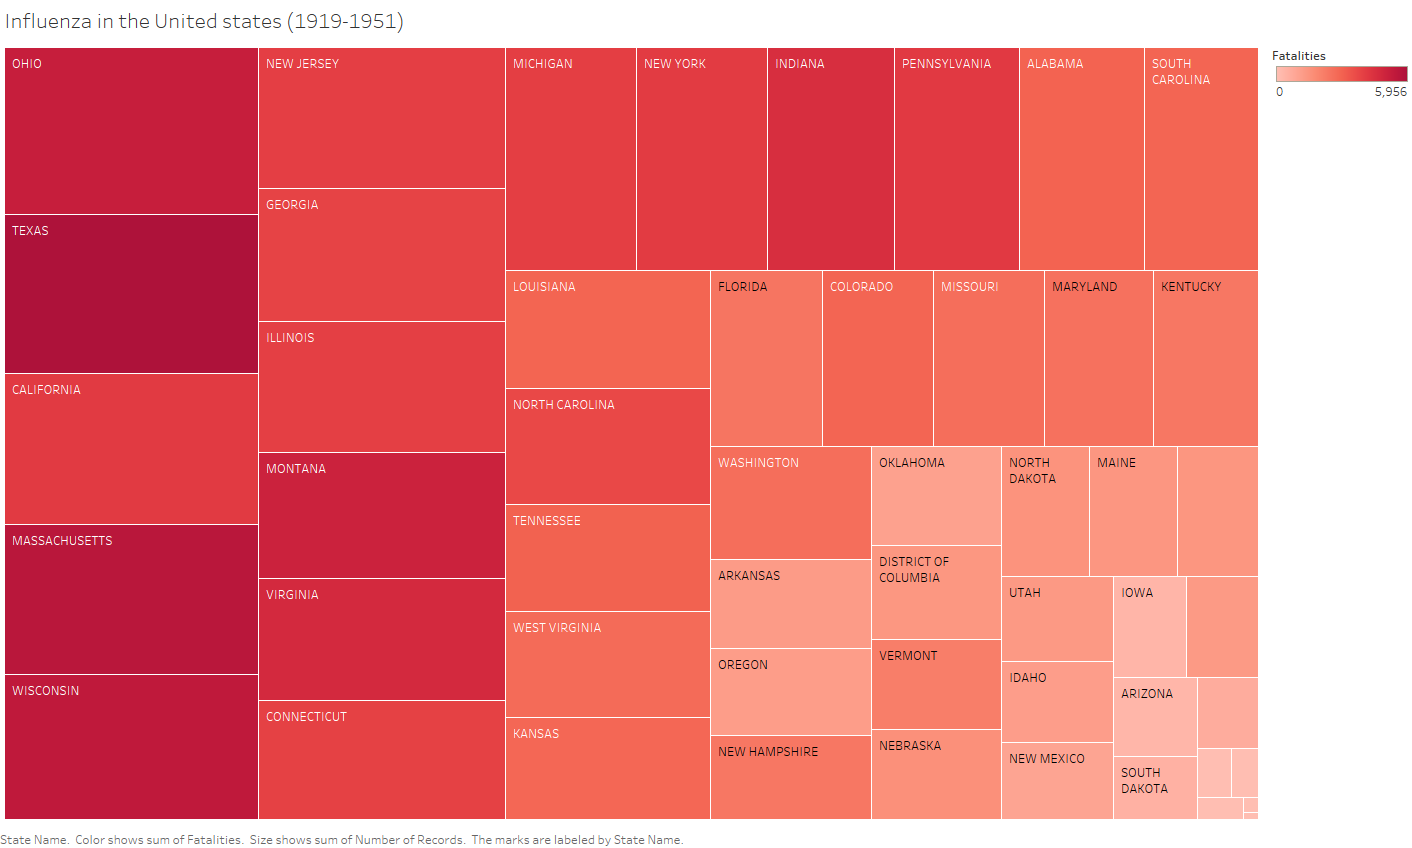
Visual design type: Treemap
Name of tool: Tableau
Country: United States of America
Disease: Influenza
Year: 1919-1951
Data Prepartion: No extra data preparation was taken
Mapping: Colour is mapped to the number of fatalities in each state and the size of each state shows the number of records of influenza the state recorded in that time period
Source: Data set used(DOI) : 10.25337/T7/ptycho.v2.0/US.6142004
Question:
*Hi, I am a student from Swansea University that as part of an assignment we are to visualise datasets from the Project tycho datasets : https://www.tycho.pitt.edu/ . In this assignment we need to produce a treemap in which we need to describe its features such as:
-
its data hierarchy
-
what the leaf node size is mapped too
-
how the leaf nodes are laid out
-
what are the internal nodes mapped too
-
what tree node layout algorithm is used
My question therefore is, is there a way to retrieve this data from tableau so that I can be sure what layout algorithm has been used or to know how the leaf nodes have been positioned or do I have to use resources such as Treemapping - Wikipedia and attempt to match the output to the algorithm (in this case)?