Hi,
I’m a student at Swansea Uni and as part of an assessment I am required to visualise data from Project Tycho (https://www.tycho.pitt.edu/). I’ve decided to take a historical look at various diseases in New England, USA. Below, is my visualisation.
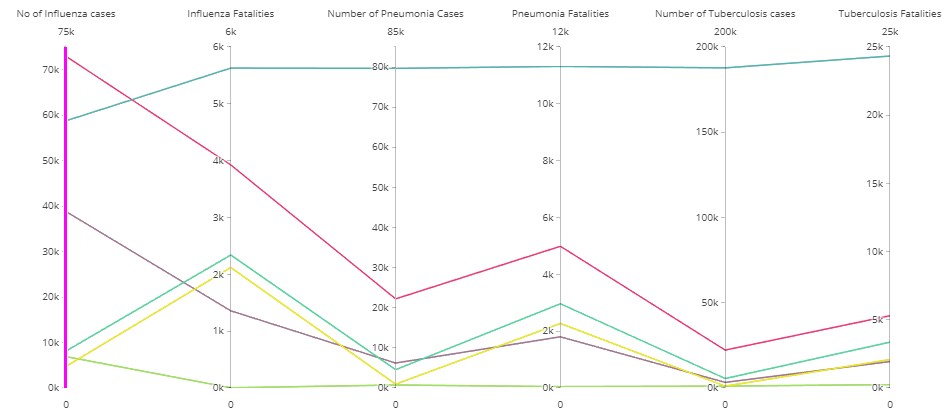
Visual Design Type: Parallel Co-ordinates
Name of Tool: Plotly
Country(s): United States of America
States : Maine, Vermont, New Hampshire, Massachusetts, Rhode Island, Connecticut
Disease(s): Tuberculosis, Pneumonia, Influenza
Year: 1891 to 2014
Visual Mappings:
Colour: Colour of line mapped to state.
Red = Connecticut
Blue = Massachusetts
Purple = Maine
Blue = New Hampshire
Yellow = Rhode Island
Green = Vermont
Unique Observation: We can see that several of the lines from each state follow each other in a parallel-like fashion. This can be seen clearly with the red, blue and green lines. This shows us that the dimensions are correlated and that state doesn’t massively affect the survival rate. We can see that in Massachussets and New Hampshire that 25% of cases of Pneumonia resulting in death. Another unique observation is that Maine had 4x the amount of Influenza cases than New Hampshire and Rhode Island, but had less fatalities.
Data Preparation: Due to the format of the datasets used, I had to calculate the actual number of fatalities caused by the disease.
DOI: 10.25337/T7/ptycho.v2.0/US.6142004,
10.25337/T7/ptycho.v2.0/US.233604007,
10.25337/T7/ptycho.v2.0/US.56717001
Literature: I’ve been reading around this type of visualisation and how to analyse the results. I found the paper titled “Multidimensional Detective” [1] by A Inselberg helpful.
Questions:
Is there any way to include to visualise impact of these diseases over time using Parallel Co-ordinates?
Is it possible to include discrete data?
Should I scale the data per 100,000 people (etc) in the state? Any advice on this would be welcome given the data gathered is over a large time period.
Also, any general feedback will be welcomed.
References:
[1] Inselberg, Alfred. “Multidimensional detective.” Proceedings of VIZ’97: Visualization Conference, Information Visualization Symposium and Parallel Rendering Symposium . IEEE, 1997.