
Image:
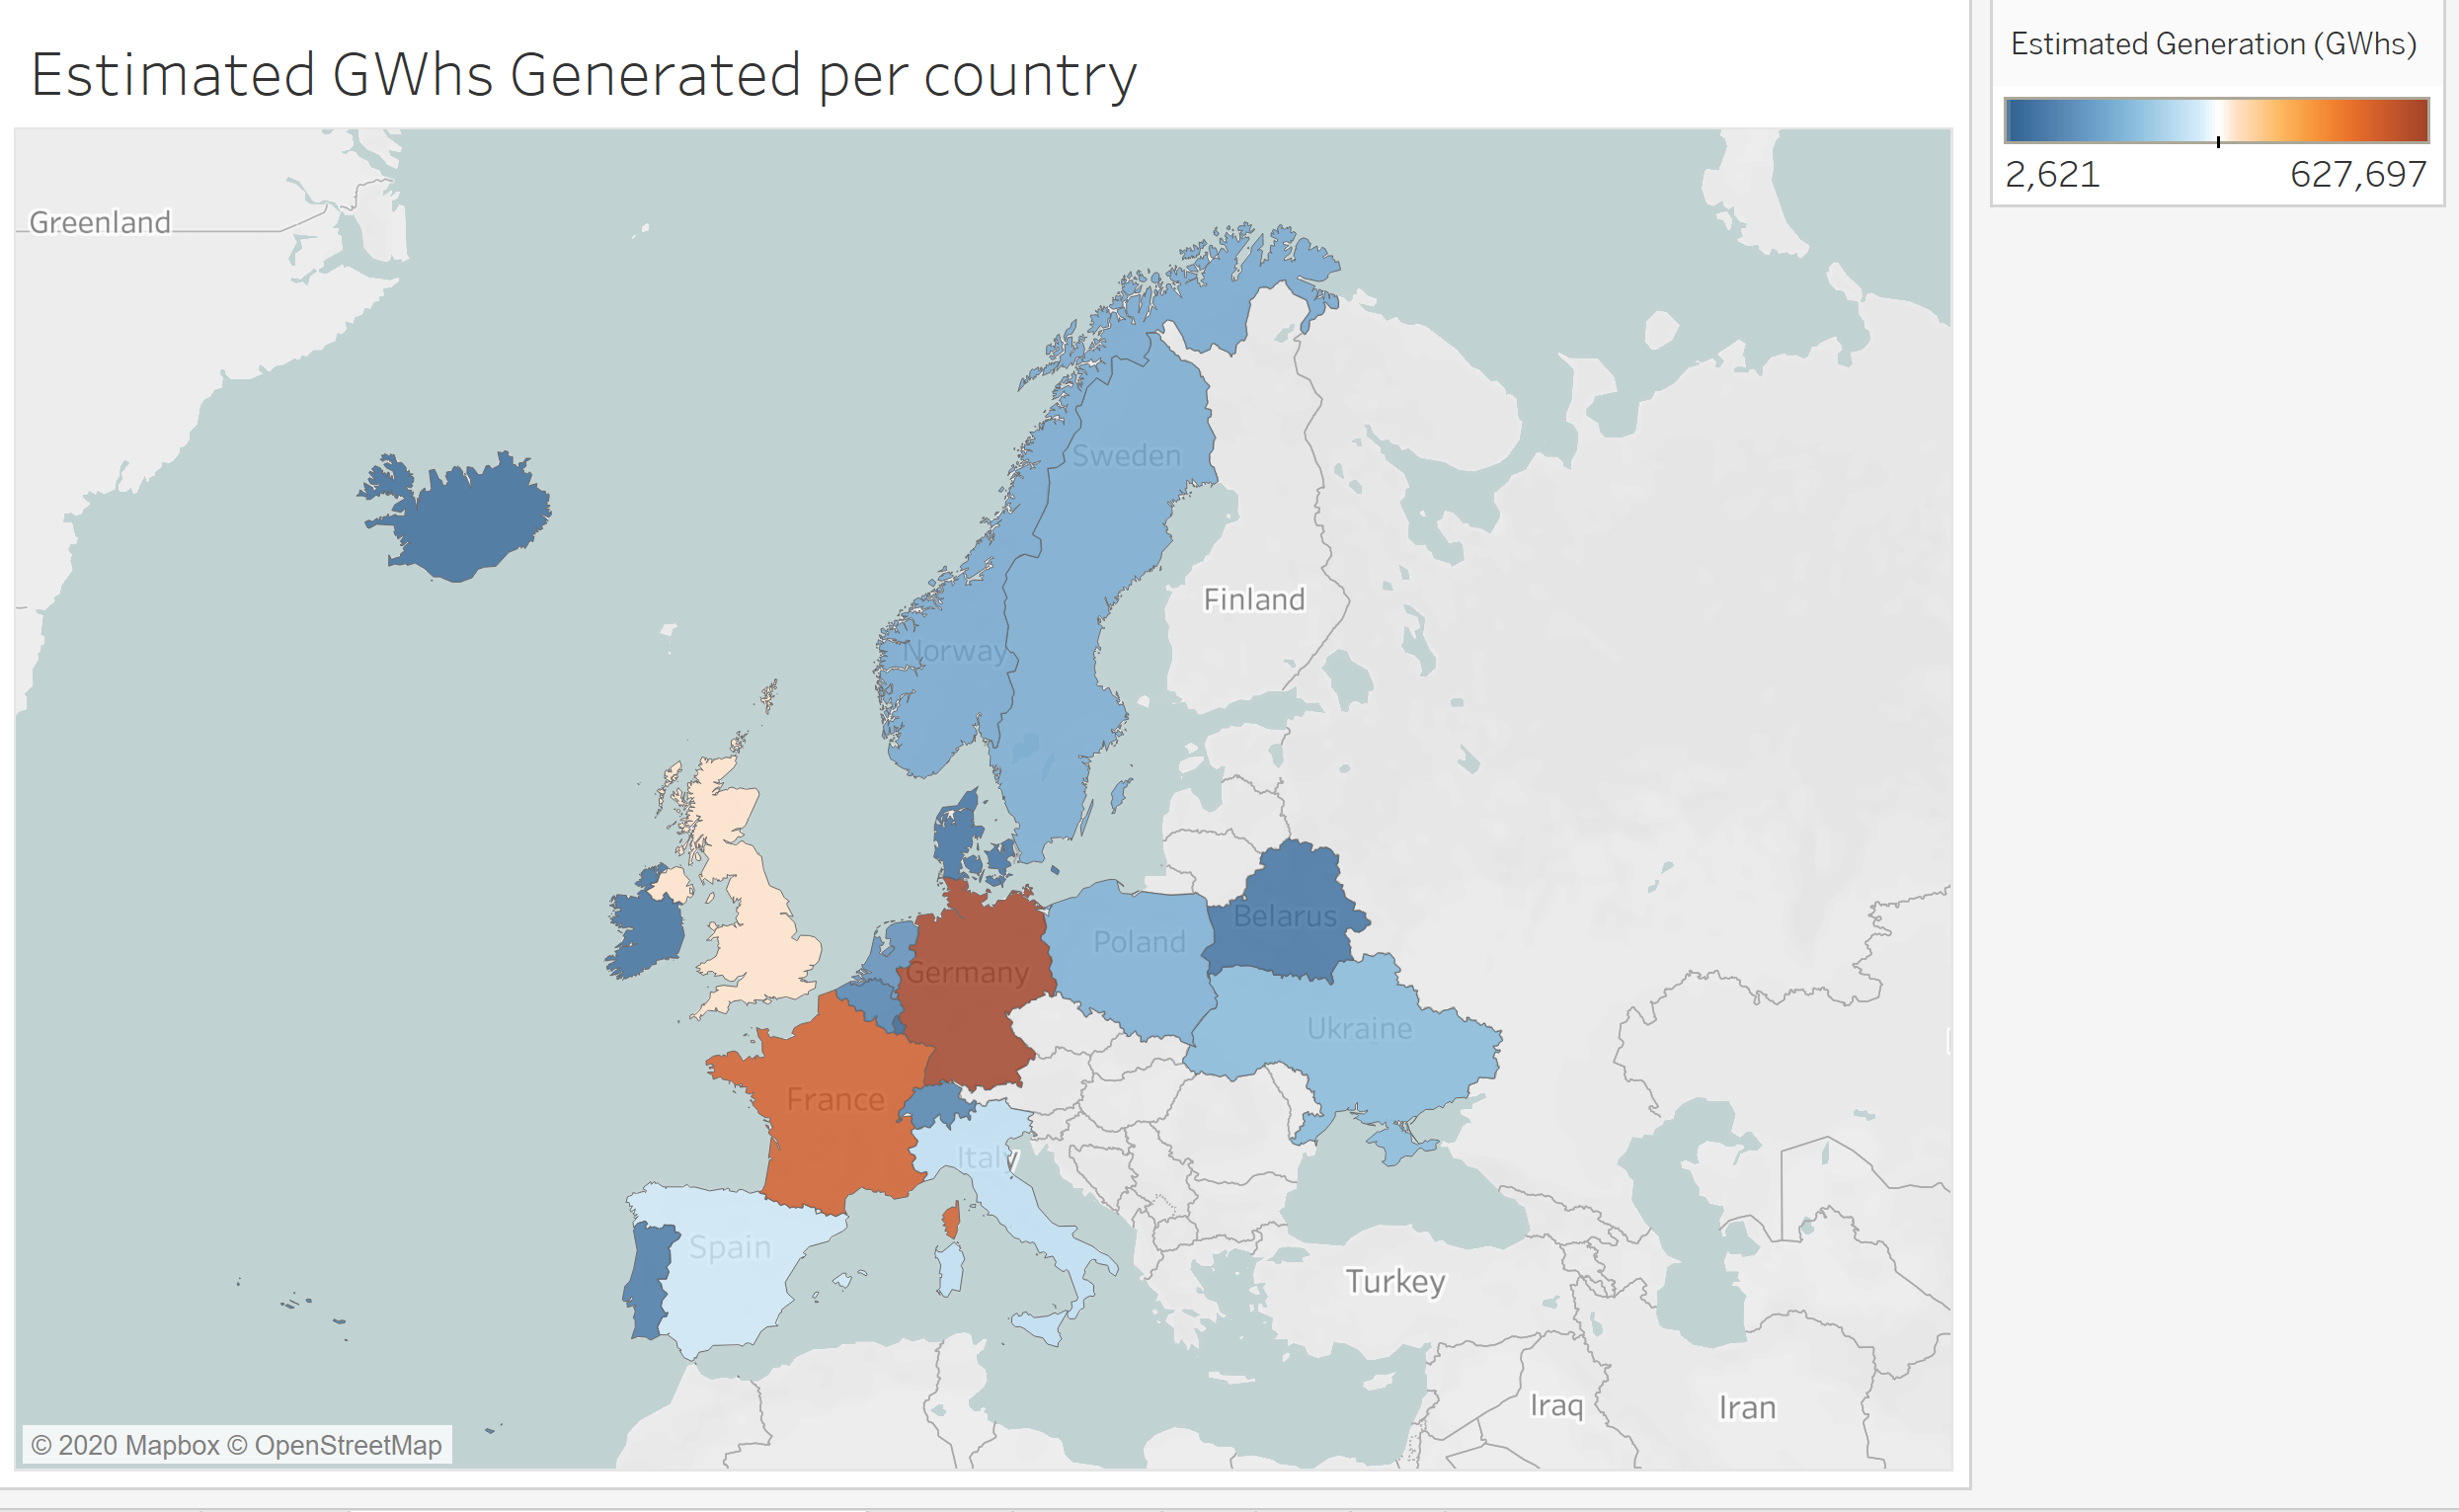
Visual Design Type: Choropleth Map
Name of Tool: Tableau
Country: Belarus, Belgium, Denmark, France, Germany, Iceland, Ireland, Italy, Luxembourg, Netherlands, Norway, Poland, Portugal, Spain, Sweden, Switzerland, Ukraine, United Kingdom.
Visual Mappings: The map shows the countries colour coded as per the estimated electricity that they generate annually in gigawatt hours (GWhs). A dark blue shows the lowest number of GWhs, whereas a darker red shows a greater generation of GWhs. Lighter blues, white, and lighter reds are more in the middle of the scale.
Unique Observation: Germany and France generate the most electricity annually out of the observed countries, with Iceland, Ireland, Denmark and Belarus all being at the lower end of the scale.
Data Set: From the World Resources Institute; data available from: http://datasets.wri.org/dataset/globalpowerplantdatabase
and a report available at: https://wriorg.s3.amazonaws.com/s3fs-public/global-power-plant-database-technical-note_1.pdf
Questions
Firstly I’m wondering what the best way to show the actual numbers along with this visualization would be. I thought of just adding the labels but that would look a bit messy, especially with the likes of Luxembourg, Netherlands, and Belgium all being so small and close together.
Further to this would there have been a better colour scheme to use to show differences? I tried using stepped colours but I ended up with countries that should be different being the exact same. Essentially I’m wondering how to effectively show that there is a ~16,000 difference between Luxembourg and Iceland, and a further ~33,000 difference between Iceland and Portugal.
Even if there would be a specific visualization that would better all round.
Thank you for your time, any tips would be greatly appreciated.